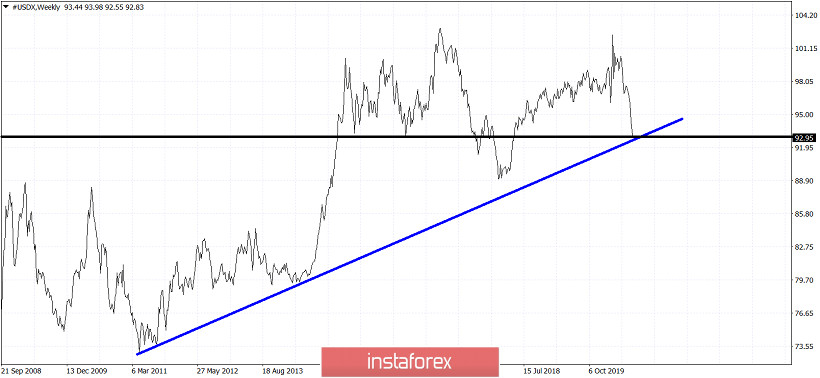
The Dollar index is trading around the 93 price level. Price has made a steady decline recently from the 102 level. Trend is bearish. Price is now challenging important support levels.

Black line - Horizontal support
The Dollar index is at the confluence of two important long-term trend lines. The one is the blue upward sloping trend line as shown in the weekly chart above that comes from 2011 lows. The next trend line is the horizontal support that was previously tested twice in 2015 and 2016. The 92-93 zone is key for the longer-term trend. Holding above it would be an important sign supporting the long-term up trend.


