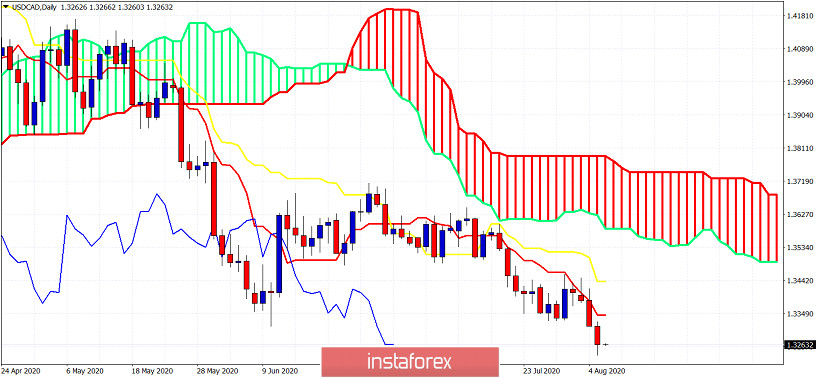
USDCAD is making new lower lows as expected after breaking below the key support zone around 1.3350. Price is now trading just above 1.3250 and more downside is expected to follow.

Using the Ichimoku cloud indicator we are going to identify some key short-term levels that if broken upwards will affect the down trend. Trend is bearish as price is below both the tenkan-sen and kijun-sen (red and yellow line indicators). Resistance by these indicators is at 1.3345 (previous support now resistance) and at 1.3435. The Kumo provides resistance at 1.3585. The Kumo (cloud) has a negative slope. If price bounces and recaptures 1.3350, we could expect price to challenge 1.3435 next and if this resistance is broken we should see price challenge the lower channel boundary. I prefer to use the tenkan-sen as a fast stop loss level to protect my gains from our bearish signal given at 1.35. Any strong bounce is seen as an opportunity to sell for a move towards 1.30.


