


Overview of GBP / USD with a forecast for the current day
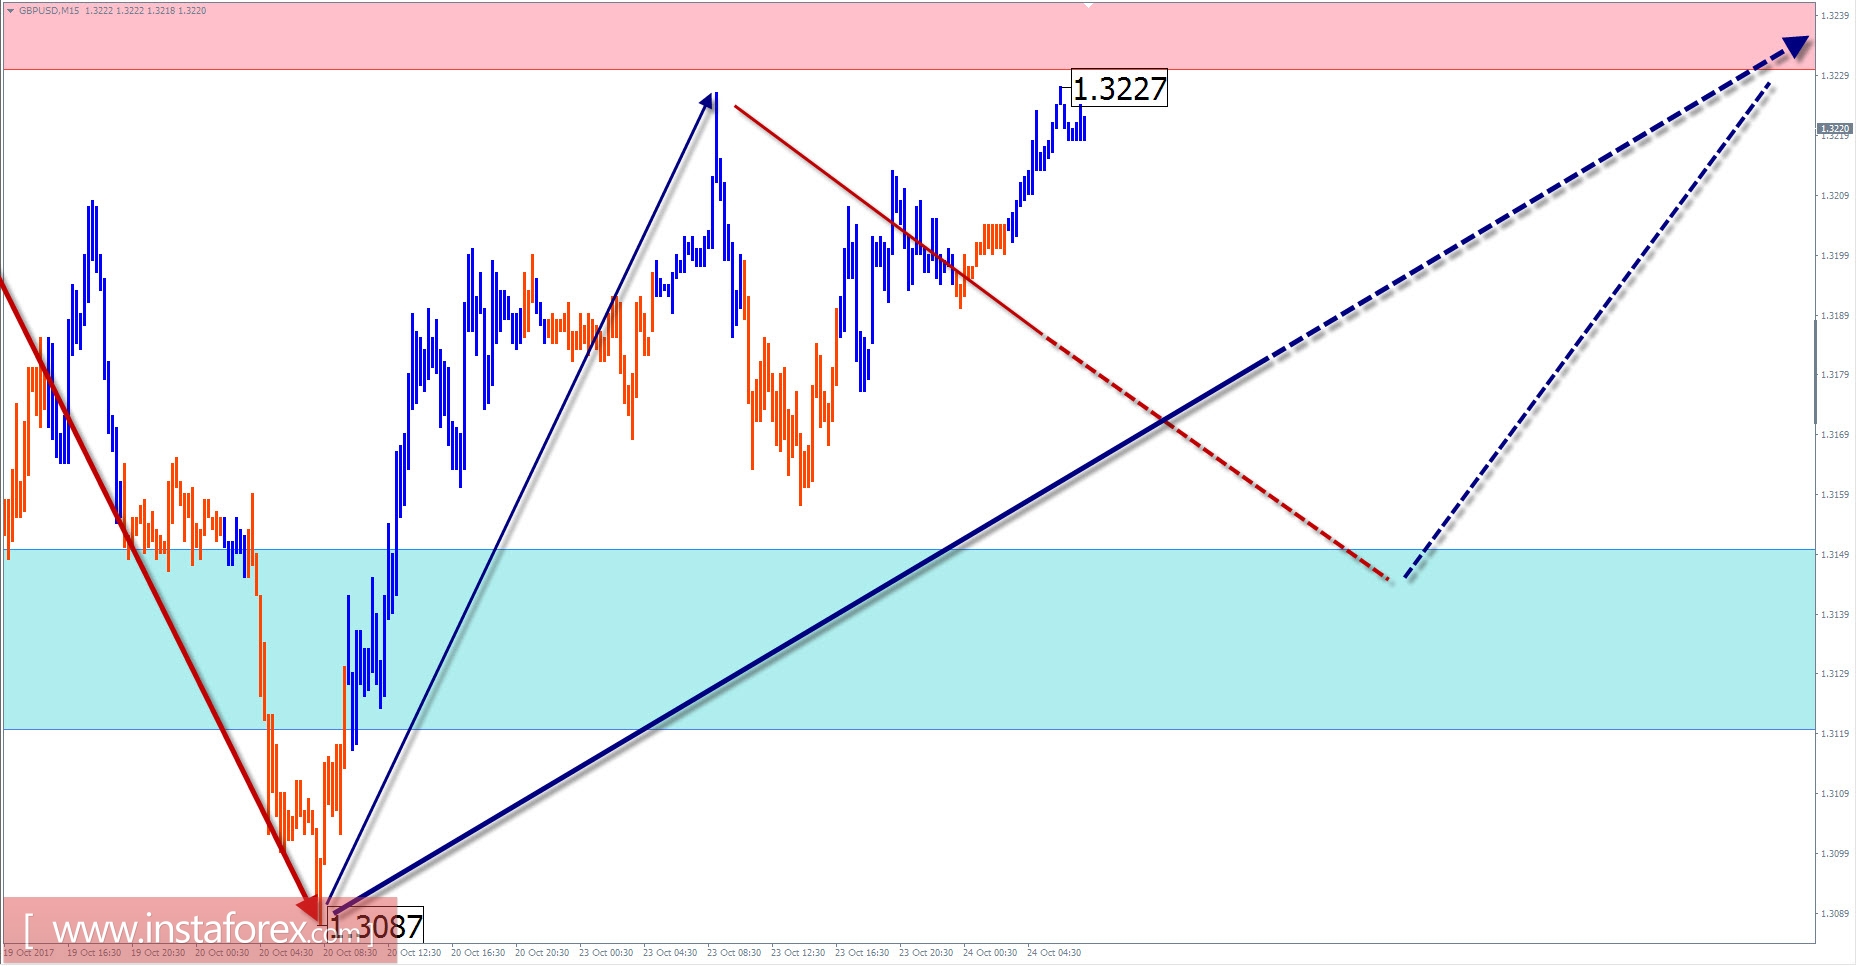
The daily scale of the time-frame of the major currency of the British currency since October last year shows an upward price movement. By the middle of last month, the pair's quotes reached the lower boundary of the preliminary target zone. The contact provoked the onset of counter wave design of small scale. After the completion of the first part of the wave (A), from October 6, the chart forms a corrective zigzag (B), incomplete so far. Since the end of last week, the movement vector has changed, beginning to form the final part of the correction.
Today, the flattering mood of the pair is more likely. After the contact with the zone of resistance, the exchange rate and the course of the price are expected to decrease. With a high probability, the scale of the decline will not exceed the distance to the support zone.
The further trading strategy should be based on the priority of the upward movement of the pair.
The boundaries of the resistance zones:
- 1.3230 / 60
The boundaries of the support zones:
- 1.3150 / 20
Overview of USD / JPY with the current day forecast
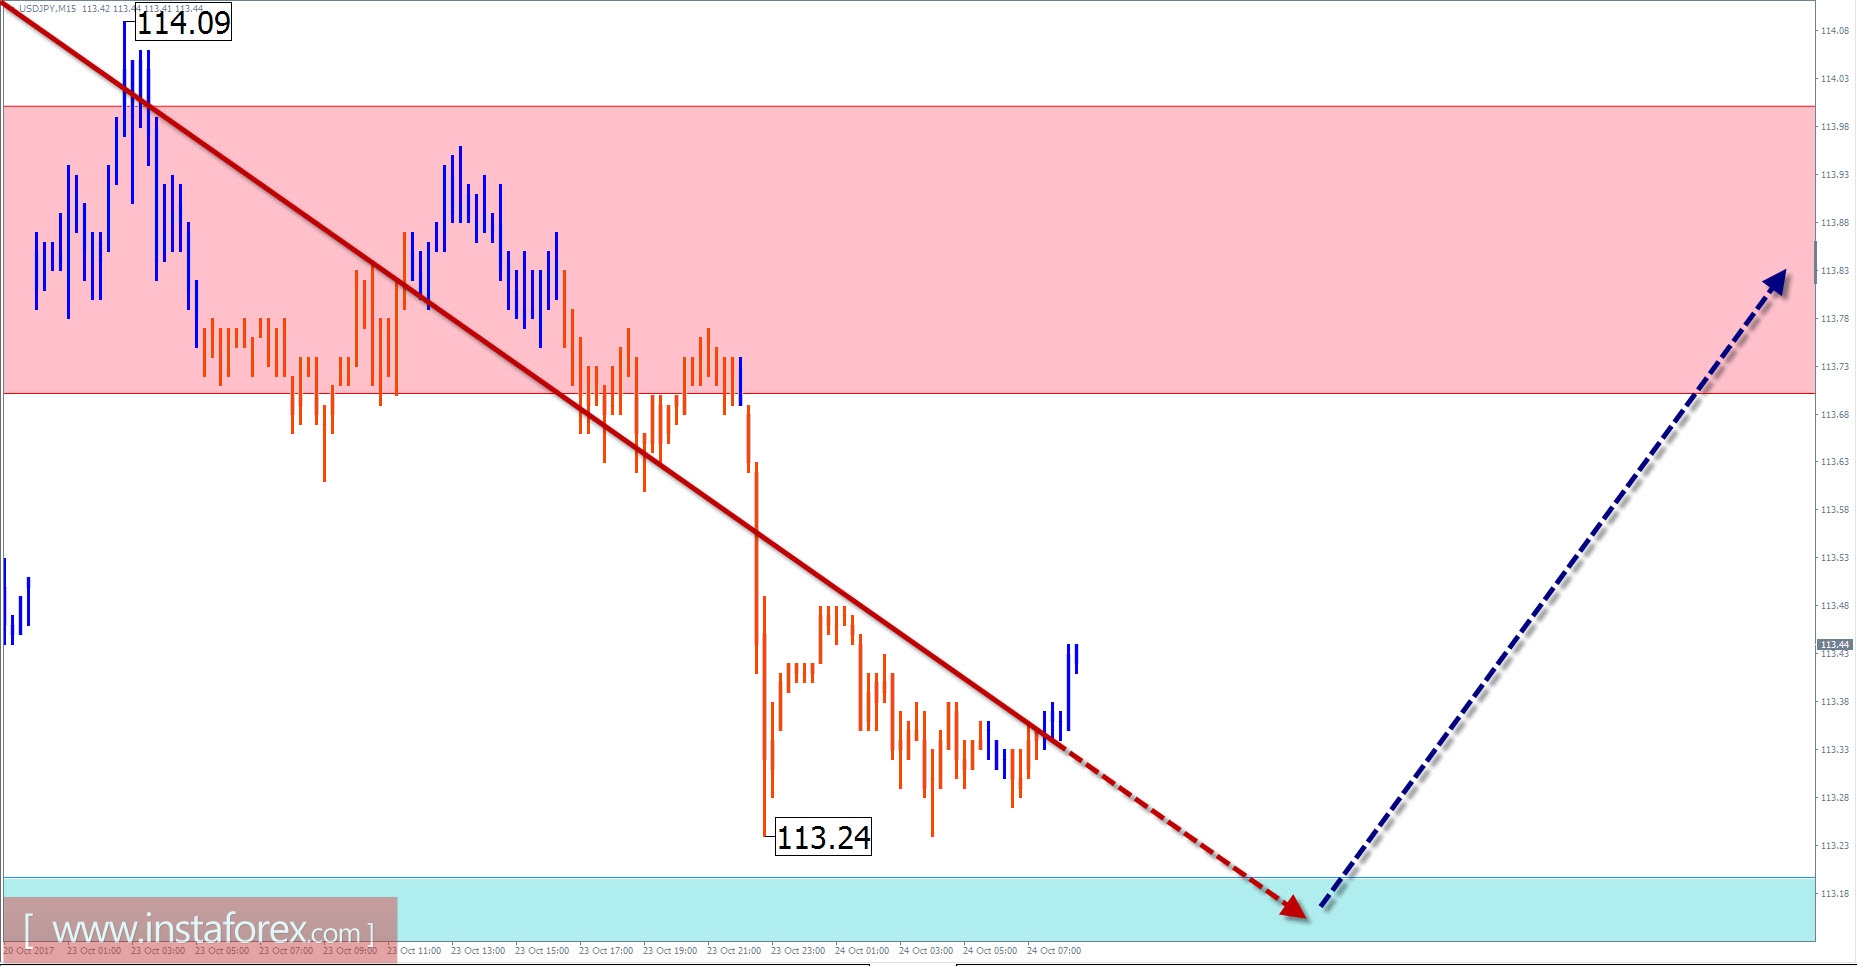
At the hourly scale of the major Japanese yen pair, the dominant direction is set by the upward wave of September 8. The nature of this motion is close to the momentum, the growth potential has not been fully utilized. All the current month, quotations in the flat form the corrective phase of the movement. The wave has the wrong kind of structure. To continue the main trend, there is not enough of a final breakthrough down.
Today, fluctuations in the exchange rate of the pair in the price corridor between the nearest counter payment zones are expected. The completion of the decline is more likely in the nearest trading session. The beginning of the phase of the rise in prices can be expected closer to the end of the day.
The boundaries of the resistance zones:
- 113.70 / 114.00
The boundaries of the support zones:
- 113.20 / 112.90
Explanations to the figures: For simplified wave analysis, a simple waveform is used that combines 3 parts (A; B; C). Of these waves, all kinds of correction are composed and most of the impulses. On each considered time frame the last, incomplete wave is analyzed.
The areas marked on the graphs are indicated by the calculation areas in which the probability of a change in the direction of motion is significantly increased. Arrows indicate the wave counting according to the technique used by the author. The solid background of the arrows indicates the structure formed, the dotted one indicates the expected wave motion.
Attention: The wave algorithm does not take into account the duration of the tool movements in time. The forecast is not a trading signal! To conduct a trade transaction, you need to confirm the signals of your trading systems.


