


Overview of USD / CHF with the forecast for the current day
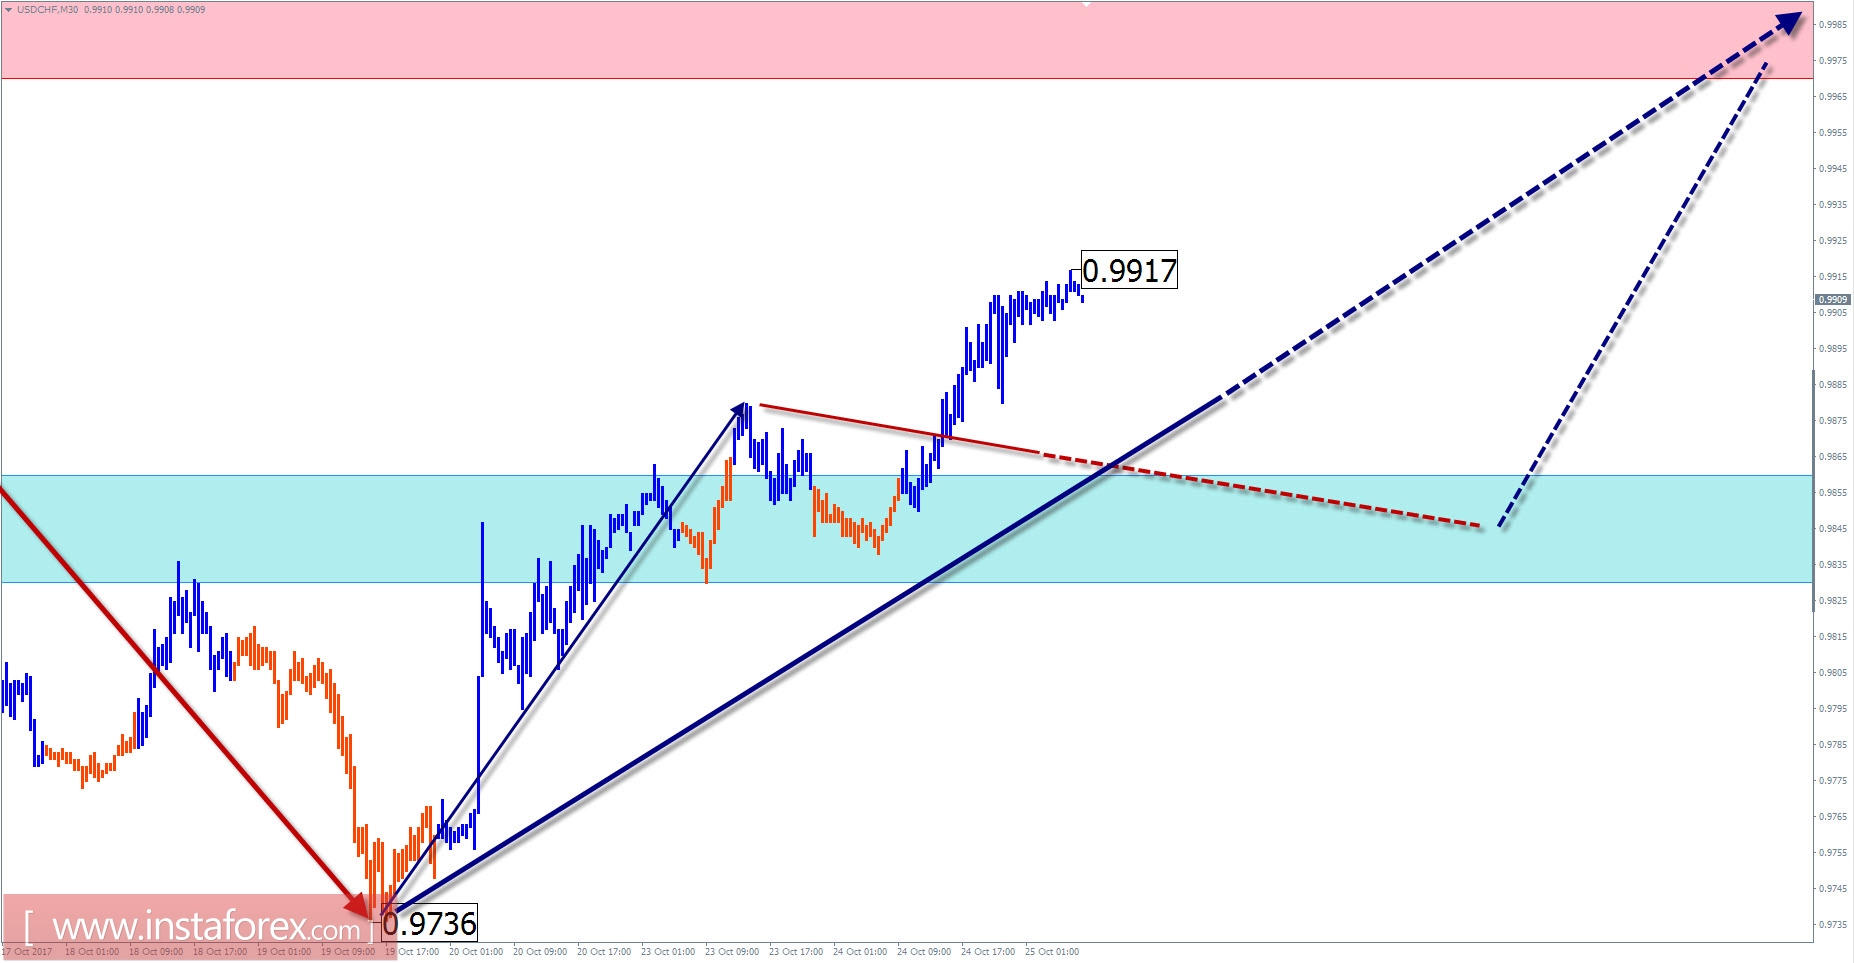
The direction of the short-term trend in the chart is based on the pair of Swiss francs ascending wave from August 29. The analysis of the structure indicates the incompleteness of the wave model. The calculation of the control zones of the potential turn allows one to assume, at a minimum, a stopping of the rise within the nearest resistance zone.
Within the current impulse structure, a latent correction was completed at the beginning of the week. Since September 19, a new trend segment has started up.
Today, in the first half of the day, the descending mood of movement is more likely, with a flat character. The change in the motion vector and the increase in volatility are expected closer to the end of the day.
The boundaries of the resistance zones:
- 0.9970 / 1.0000
The boundaries of the support zones:
- 0.9860 / 30
Overview of GBP / JPY with the current day forecast
On the daily scale of the pound / yen cross chart, the last unfinished wave looks like a geometric figure "ascending triangle". The direction of the inter-week trend at the end of this model from the middle of September is set by a bearish zigzag. In the structure of this wave, the last 2 weeks upward the middle, correcting part (B) is formed.
Two days ago, the price reached the lower limit of the potential reversal zone, which was followed by a downward pullback. The quotations are approaching the most likely end of the price cut.
In the nearest trading session, it is worth waiting for a short-term move of the pair down to the boundaries of the support zone. In the second half of the day, the probability of a change in the direction of the session trend will increase and the pair's quotations will begin to grow.
The boundaries of the resistance zones:
- 149.90 / 150.20
The boundaries of the support zones:
- 149.10 / 148.80

Explanations to the figures: For simplified wave analysis, a simple waveform is used that combines 3 parts (A; B; C). Of these waves, all kinds of correction are composed and most of the impulses. On each considered time frame the last, incomplete wave is analyzed.
The areas marked on the graphs are indicated by the calculation areas in which the probability of a change in the direction of motion is significantly increased. Arrows indicate the wave counting according to the technique used by the author. The solid background of the arrows indicates the structure formed, the dotted one indicates the expected wave motion.
Attention: The wave algorithm does not take into account the duration of the tool movements in time. The forecast is not a trading signal! To conduct a trade transaction, you need to confirm the signals of your trading systems.


