Main Quotes Calendar Forum
flag

FX.co ★ Weekly Ichimoku cloud analysis for Gold

parent
Forex Analysis:::2020-10-23T14:04:03

Weekly Ichimoku cloud analysis for Gold

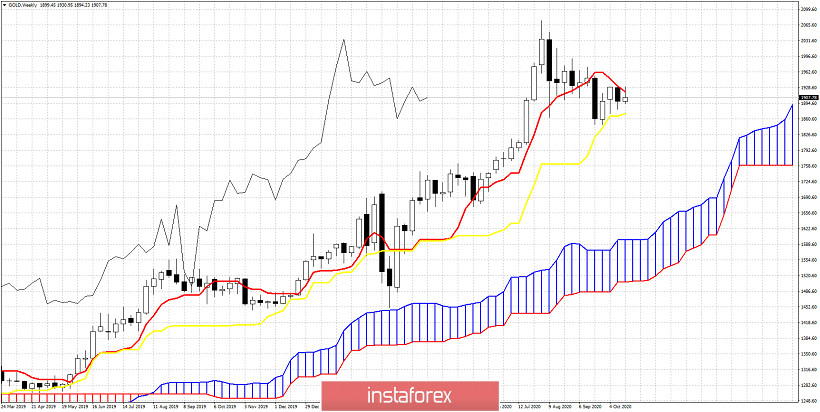
Gold price is trapped between the kijun-sen and the tenkan-sen indicators. Although longer-term trend in Ichimoku cloud terms remains bullish, there are some worrying signs that a bigger pull back could unfold until the end of the year.

Weekly Ichimoku cloud analysis for Gold

Gold price is well above the Kumo (cloud). Price is getting rejected the last two weeks at the tenkan-sen (red line indicator). This is a sign of weakness. The tenkan-sen resistance is now at $1,920. Bulls need a weekly close above $1,920. On the other hand bears are not that strong either as price has tested the kijun-sen (yellow line indicator) and have not managed to break below it yet. Support by the kijun-sen is at $1,872. A weekly close below $1,872 is what bears look for. This will imply that a move towards the cloud at $1,650-$1,700 would be likely. The Chikou span (black line indicator) is above the candlestick pattern. Support according to the Chikou span on a weekly basis is at $1,730-$1,760.
Analyst InstaForex
Share this article:
parent
loader...
all-was_read__icon
You have watched all the best publications
presently.
We are already looking for something interesting for you...
all-was_read__star
Recently published:
loader...
More recent publications...