Today we use the Ichimoku cloud indicator in order to identify key short-term support and resistance levels. What will be the target if price breaks any key short-term support level? EURUSD price is currently in a bullish trend as the Ichimoku cloud indicator indicates in the 4 hour chart.
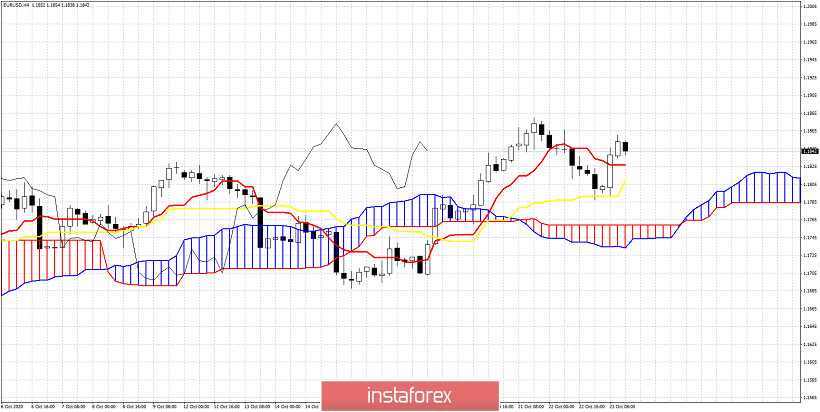
First important support level is shown by the tenkan-sen (red line indicator). This support is found at 1.1827. Next support level is at the kijun-sen (yellow line indicator) at 1.1808. As we have explained in previous posts, previous resistance is now support. So bulls need to stay above both the tenkan-sen and kijun-sen indicators. Breaking below these two indicators will open the way for a move towards the Kumo (cloud) at 1.1760. A break below 1.1760 will turn short-term trend to bearish again. The best level to buy again if you are a bull is once price bounces off the re-test of the Kumo. So if price pulls back all the way to 1.1760 and bounces, then this would be a bullish sign. If you lean more on the bearish scenario as the most probable one, then traders should look to open short position in stages, as price breaks each support level, adding to their position and not exposing themselves in a short position from the beginning.


