


Overview of NZD / USD with the current day forecast
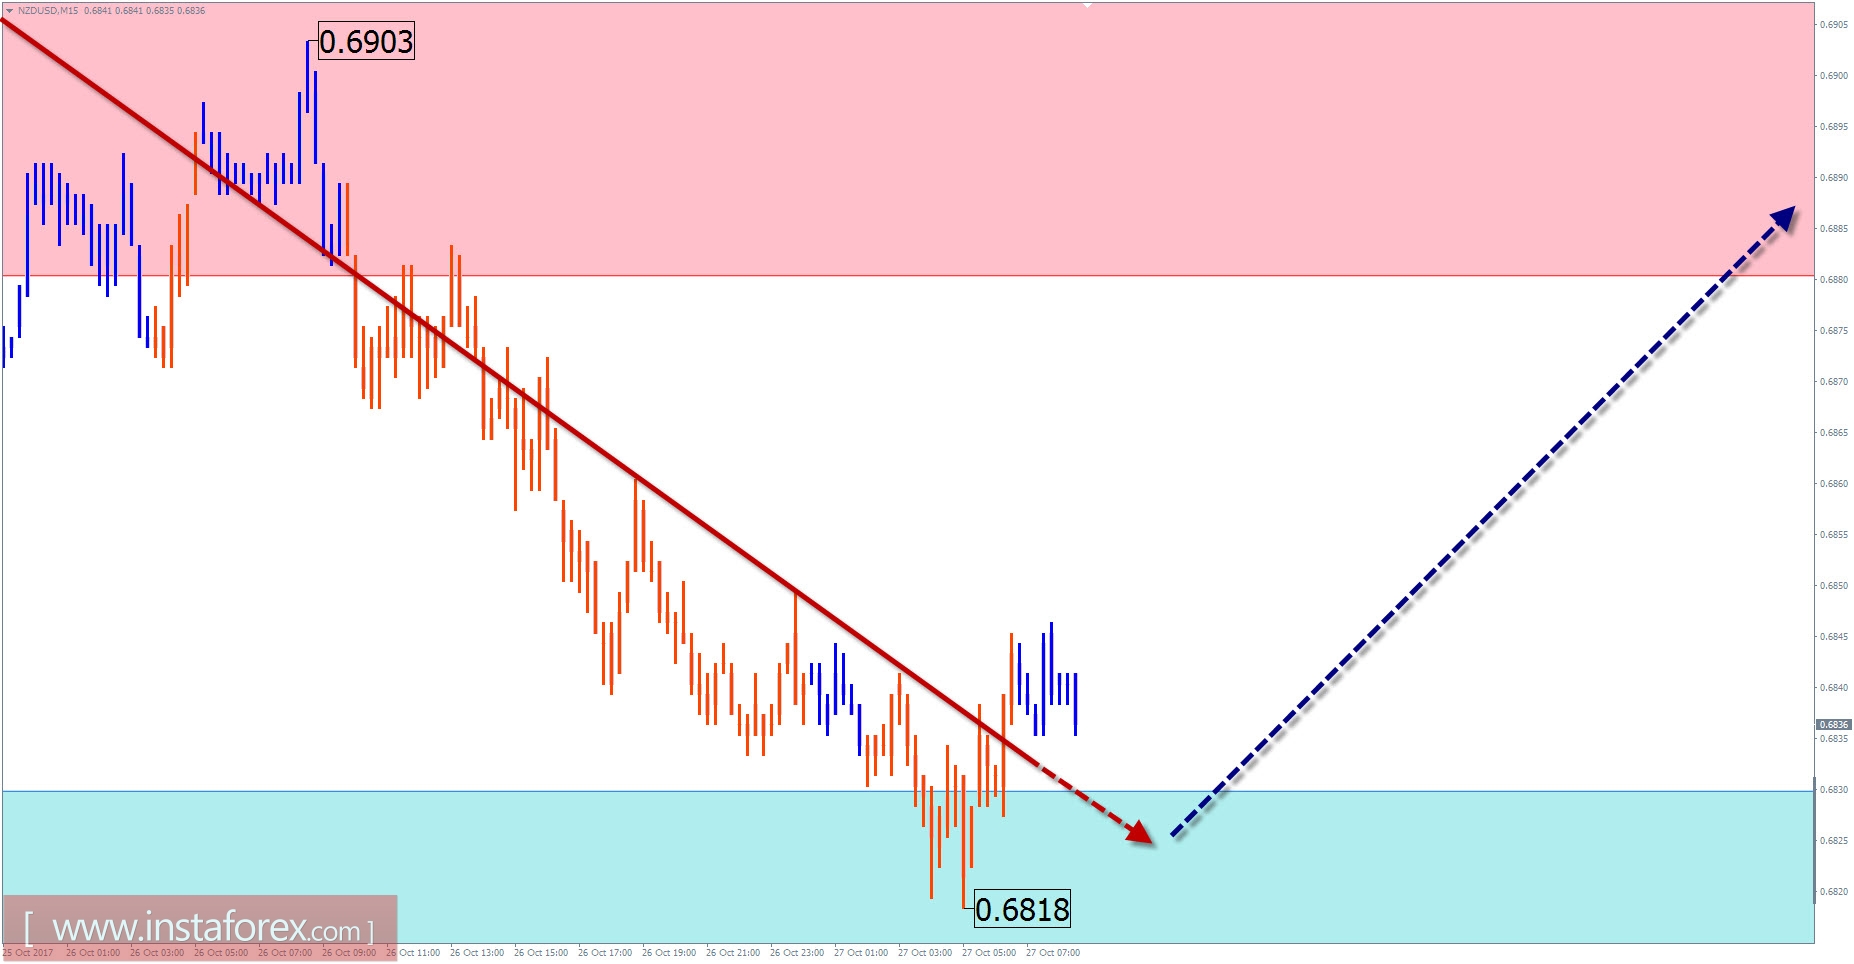
On the daily scale of the chart, as a result of the downward wave formation of July 27, the New Zealand dollar majors reached the upper limit of the powerful support zone of the large time frame. In the structure of a larger wave model, this site takes the place of the last part of the correction. For today, the wave looks formed and the proportions of all parts are sustained. The completion of the wave is expected in the coming days.
Today, the most likely scenario will be the flat movement of the pair in the lateral plane. We can expect a predominantly upward motion vector. Before pulling back up pressure on the support zone is not ruled out.
The boundaries of the resistance zones:
- 0.6880 / 0.6910
The boundaries of the support zones:
- 0.6830 / 0.6800
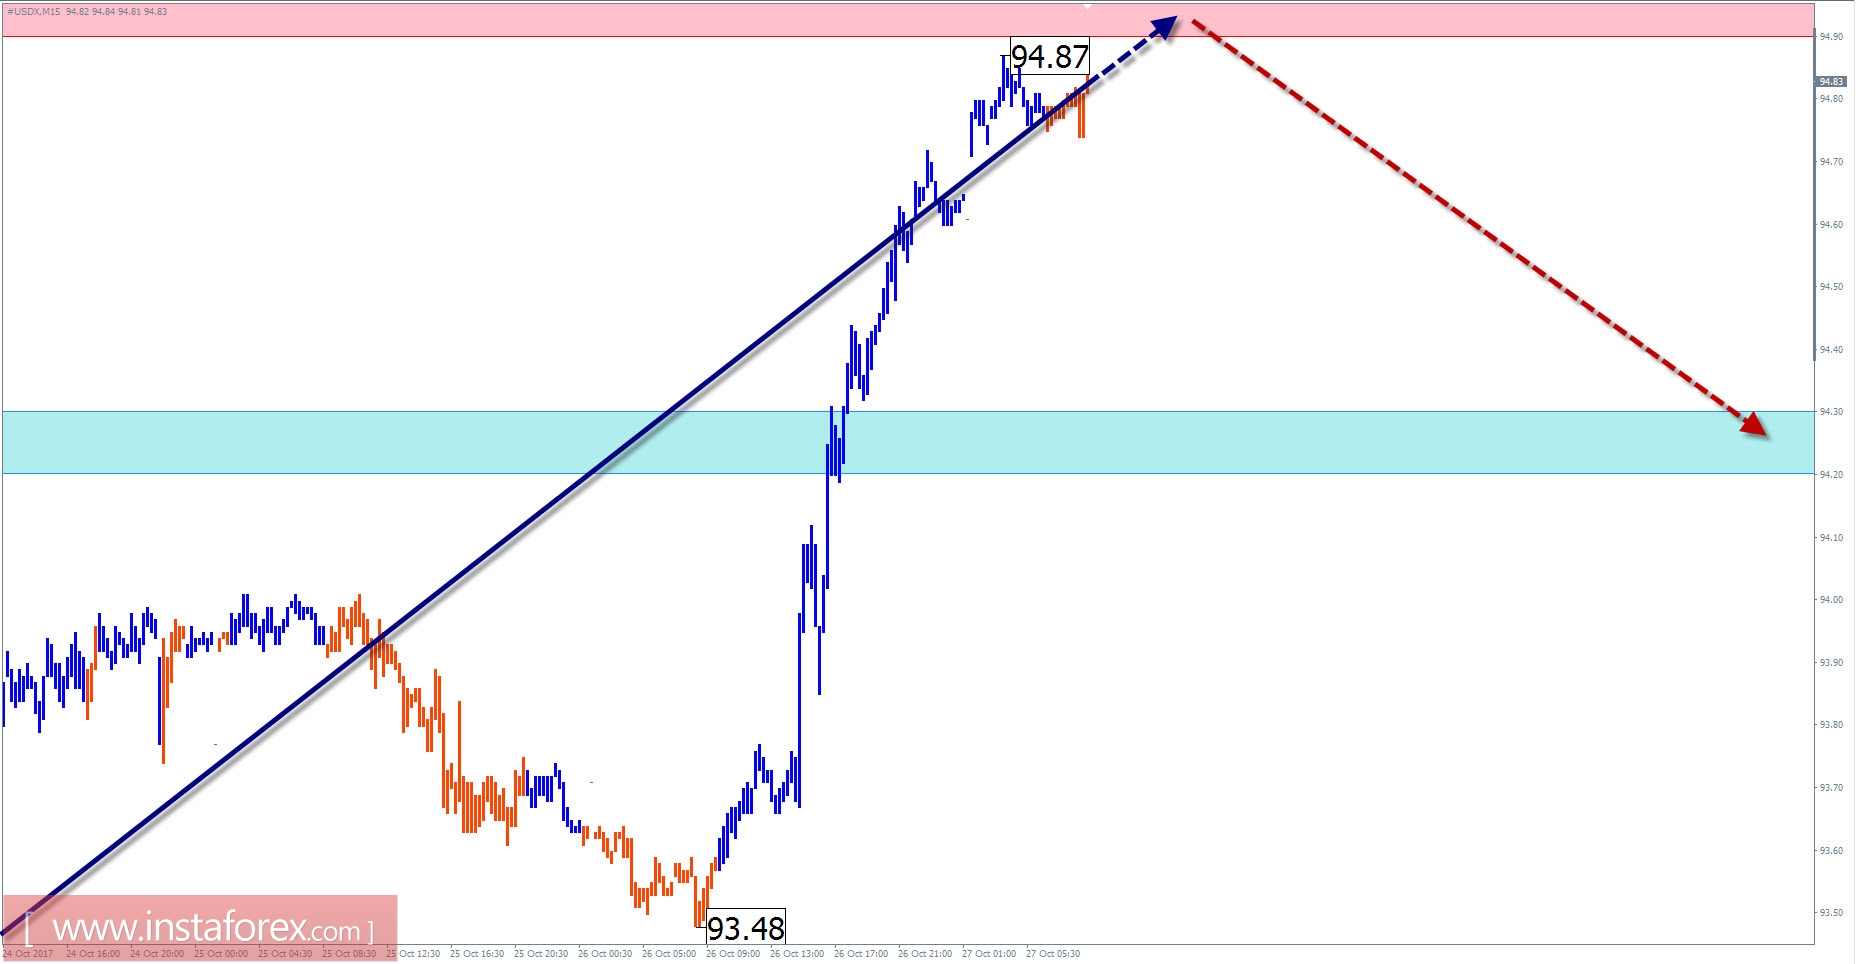
Overview of #USDX (US dollar index) with a forecast for the current day
The graph of the US dollar index is corrected after the period of decline in the first half of the year. As a result of yesterday's upward spurt, quotes reached the zone of potential reversal and reinforced by the level of the largest scale of the chart. The structure of the correctional wave looks complete.
In the near future, the dollar expects a decline. Its scope can vary. The main option is to return to the bearish vector of the movement, which is dominant from the beginning of the year. In the case of continuation of the upward course, the wave needs to form an intermediate element that raises the current wave level of the entire structure.
Today, a lateral direction is expected. The probability of a downward vector of index oscillations is high.
The boundaries of the resistance zones:
- 94.90 / 95.00
The boundaries of the support zones:
- 94.30 / 20
Explanations to the figures: For simplified wave analysis, a simple waveform is used that combines 3 parts (A; B; C). Of these waves, all kinds of correction are composed and most of the impulses. On each considered time frame the last, incomplete wave is analyzed.
The areas marked on the graphs are indicated by the calculation areas in which the probability of a change in the direction of motion is significantly increased. Arrows indicate the wave counting according to the technique used by the author. The solid background of the arrows indicates the structure formed, the dotted one indicates the expected wave motion.
Attention: The wave algorithm does not take into account the duration of the tool movements in time. The forecast is not a trading signal! To conduct a trade transaction, you need to confirm the signals of your trading systems.


