


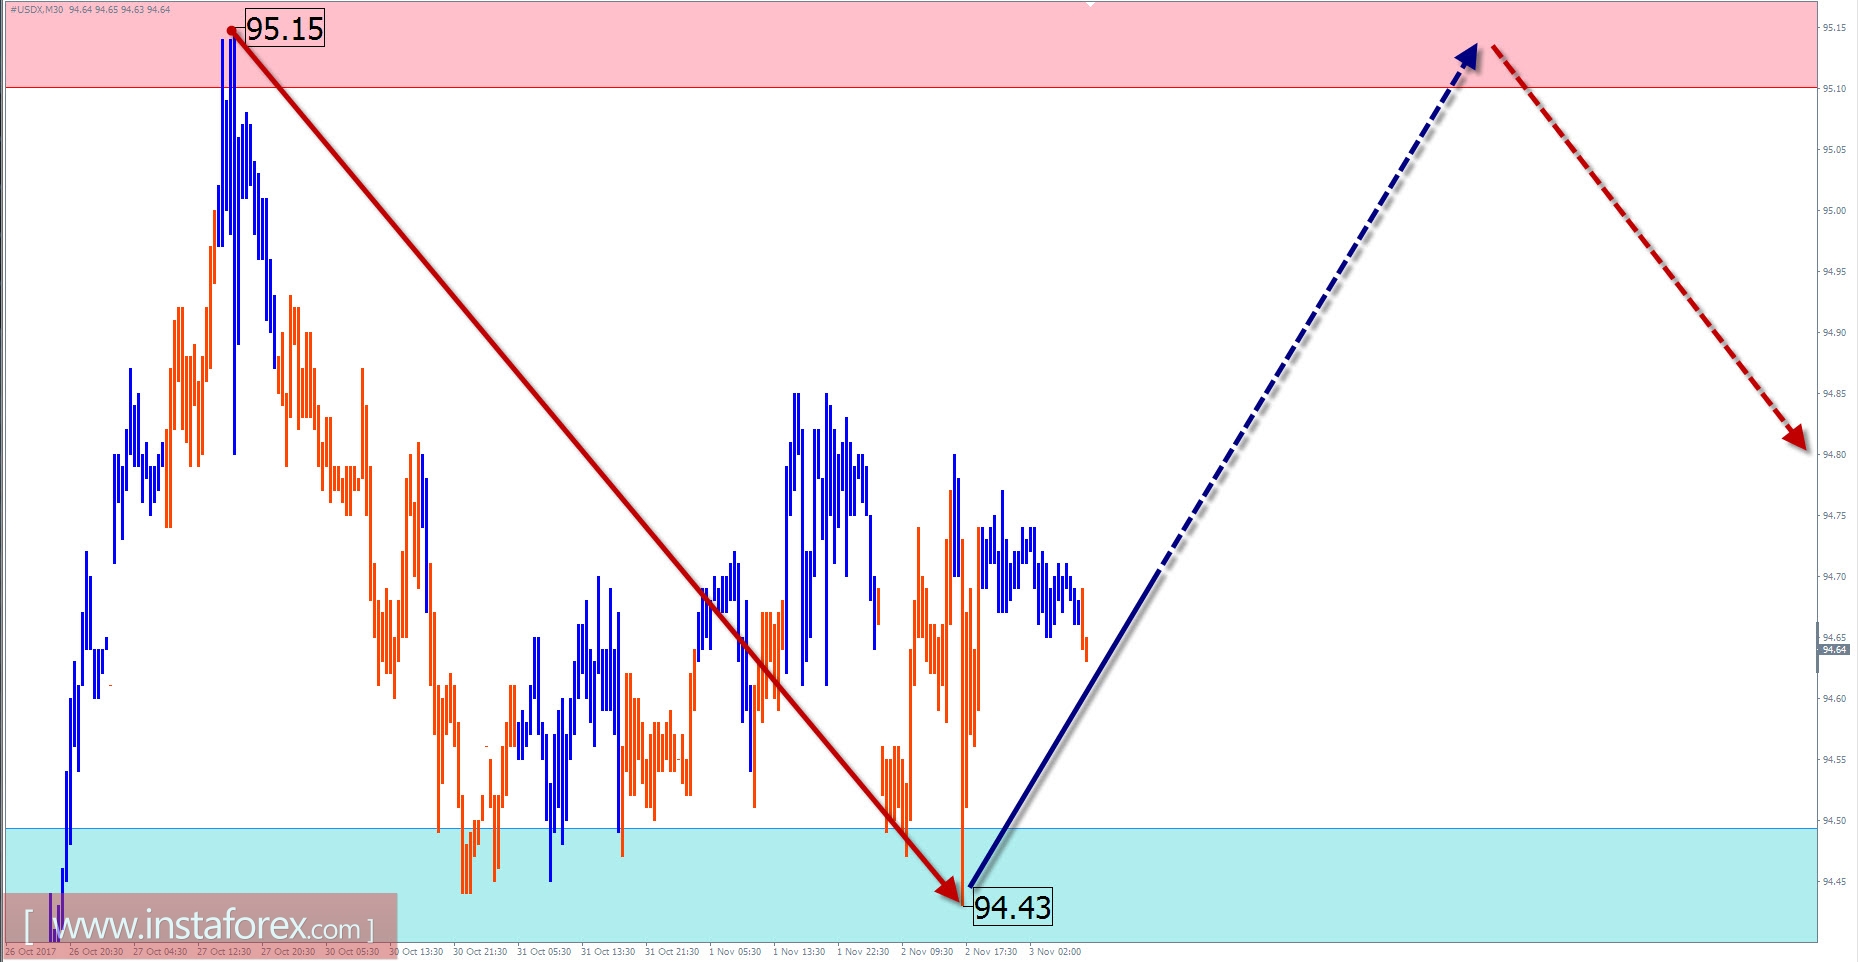
Overview of #USDX (US dollar index) with a forecast for the current day
On the weekly scale of the graph of the US dollar index, the dollar rate was established according to the wave model algorithm since March 2015. The wave structure of motion fits into the classical correctional pattern of a "stretched plane". The final part of the structure is being formed since December last year.
In the first ten days of September, the index's quotes reached the minimum settlement level whereas the completion of the current wave is possible. Confirmation of the turn should be the formation on the chart of a distinct ascending zigzag pattern in a sufficient wave level. Although this is not found in the chart, this is an argument that is in favor of continuing the main trend.
A preliminary calculation of the target zone shows the proximity of upward rollback completion in the past three months. The upcoming week is likely to change the direction of the inter-trend trend.
Today, the most likely scenario will be the growth of dollar quotations.
Boundaries of resistance zones:
- 95.10 / 20
Boundaries of support zones:
- 94.50 / 40
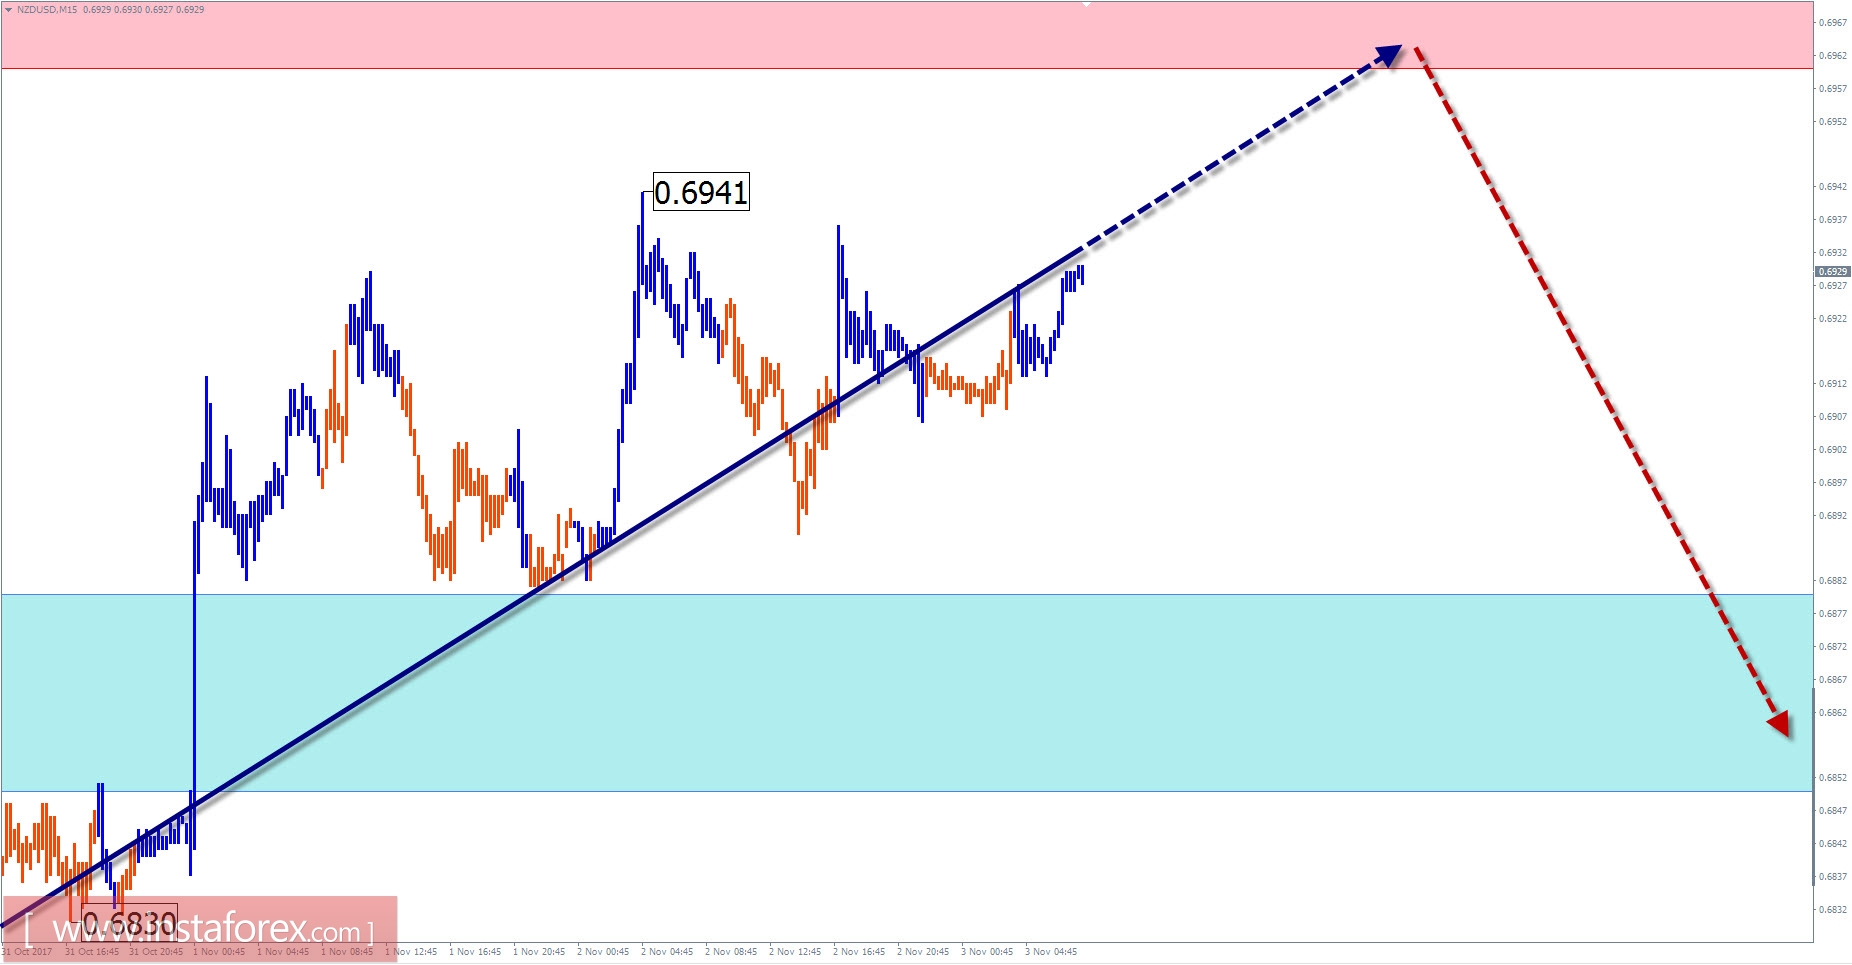
NZD / USD outlook for the current day
In the short-term scale of the New Zealand dollar major pair, the direction of the price movement was set by the descending wave, which started in late July. This area takes the place of the final part of the correction in a larger wave model. For today, its wave structure was completely formed and proportions of all parts are observed. In the middle of last month, the price reached the upper limit of a wide zone potential for a reversal. Formed signals of the reversal have not yet been formed, which indicates that downward trend continues to dominate in the upcoming sessions.
Today, the upward mood in the previous days is expected to continue until the completion of the rollback. The target site is located within the resistance zone. The probability of a change in the exchange rate and the price movement of the pair are expected to increase as the end of the day approaches.
Boundaries of resistance zones:
- 0.6960 / 90
Boundaries of support zones:
- 0.6880 / 50
Explanations to the figures: For simplified wave analysis, a simple waveform is used that combines 3 parts namely A, B, and C. All types of correction are created and most of the impulses can be found in these waves. Every time frame is considered and the last incomplete wave is analyzed.
The areas marked on the graphs indicate the probability of a change in the direction of motion has significantly increased as calculated in the areas. Arrows indicate the wave counting following the technique used by the author. A solid background of the arrows signifying the structure has been formed while the dotted one means the expected wave motion.
Attention: The wave algorithm does not take into account the duration of the movement of tools in time. The forecast is not a trading signal! To conduct a bargain, you need to confirm the signals used by your trading systems.


