


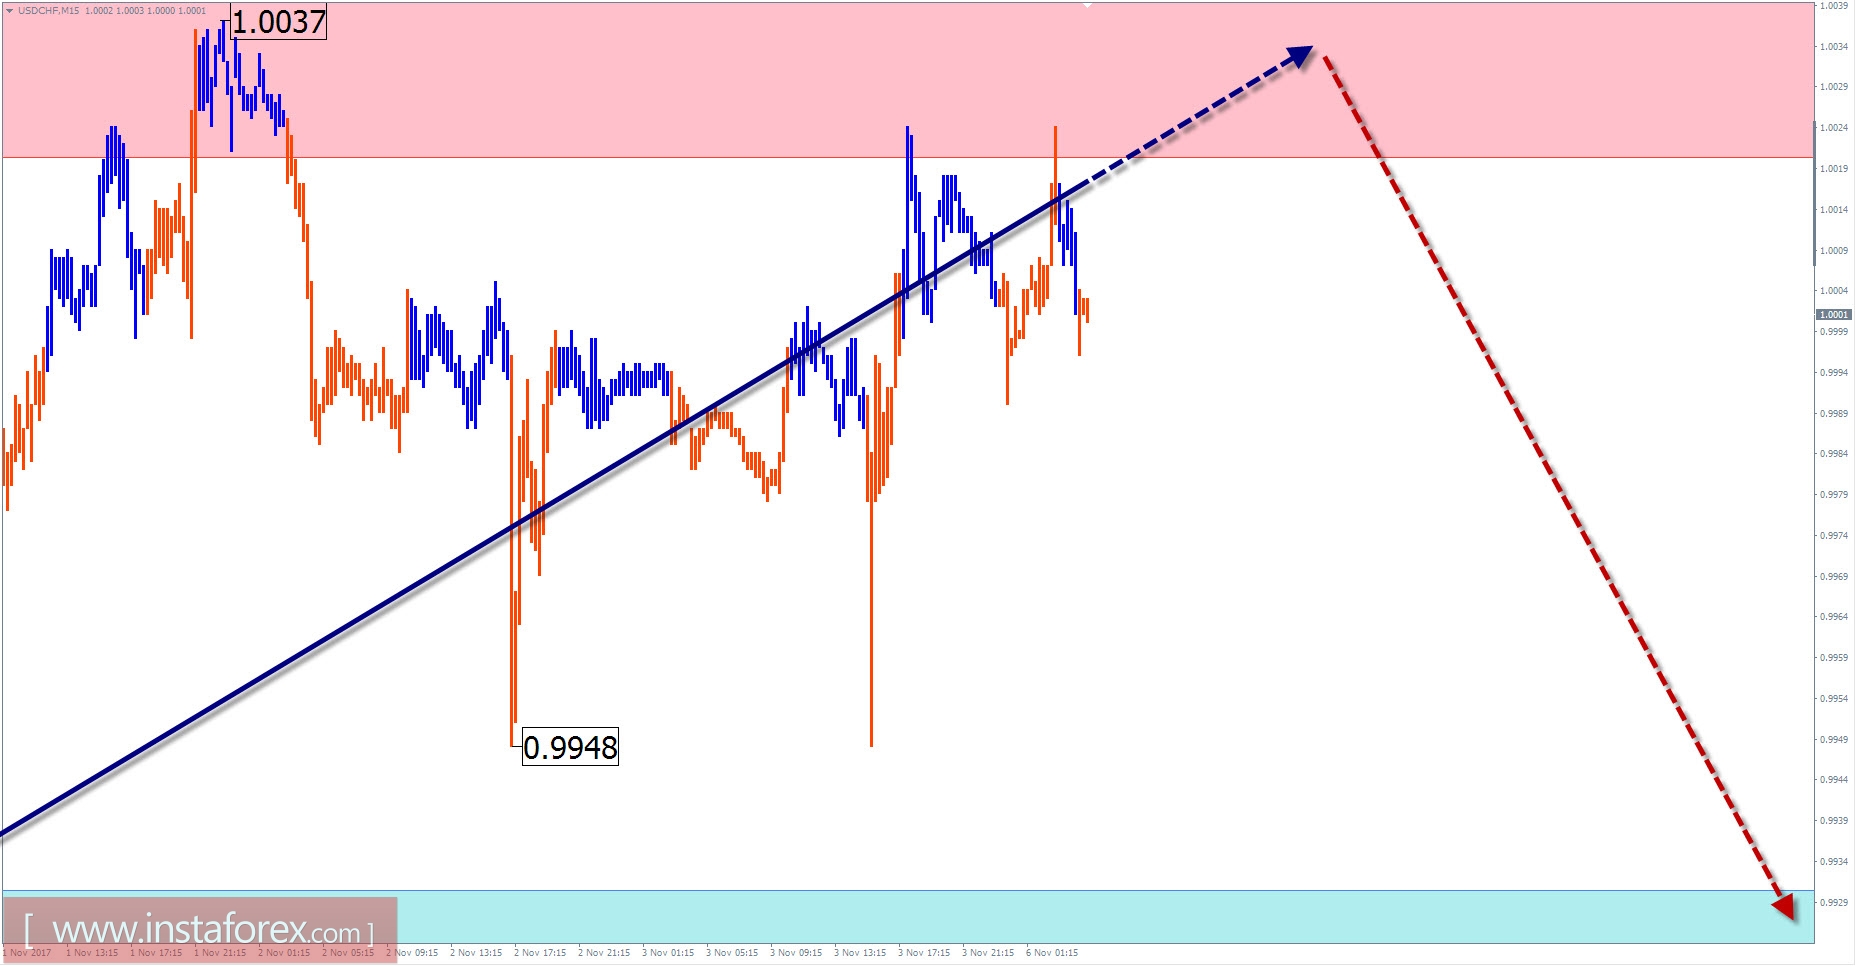
USD / CHF review with current day forecast
The final and incomplete wave structure of the chart for the major pair US dollar and the Swiss franc is directed upwards. The wave counts from the end of August. By the beginning of this month, the wave has reached the minimum level of elongation. In the current zone of the potential reversal, there is a high possibility of forming a counter price movement in the following days. Previously, in current wave structure, it will take the place of correction within the final segment (C).
Today, we expect a flat price movement at the next session. The second half of the day may be more volatile with a high chance of rates adjustment and the beginning of price reduction. The support area will limit the daily swing of the pair.
Boundaries of resistance zones:
- 1.0020 / 50
Boundaries of support zones:
- 0.9930 / 0.9900
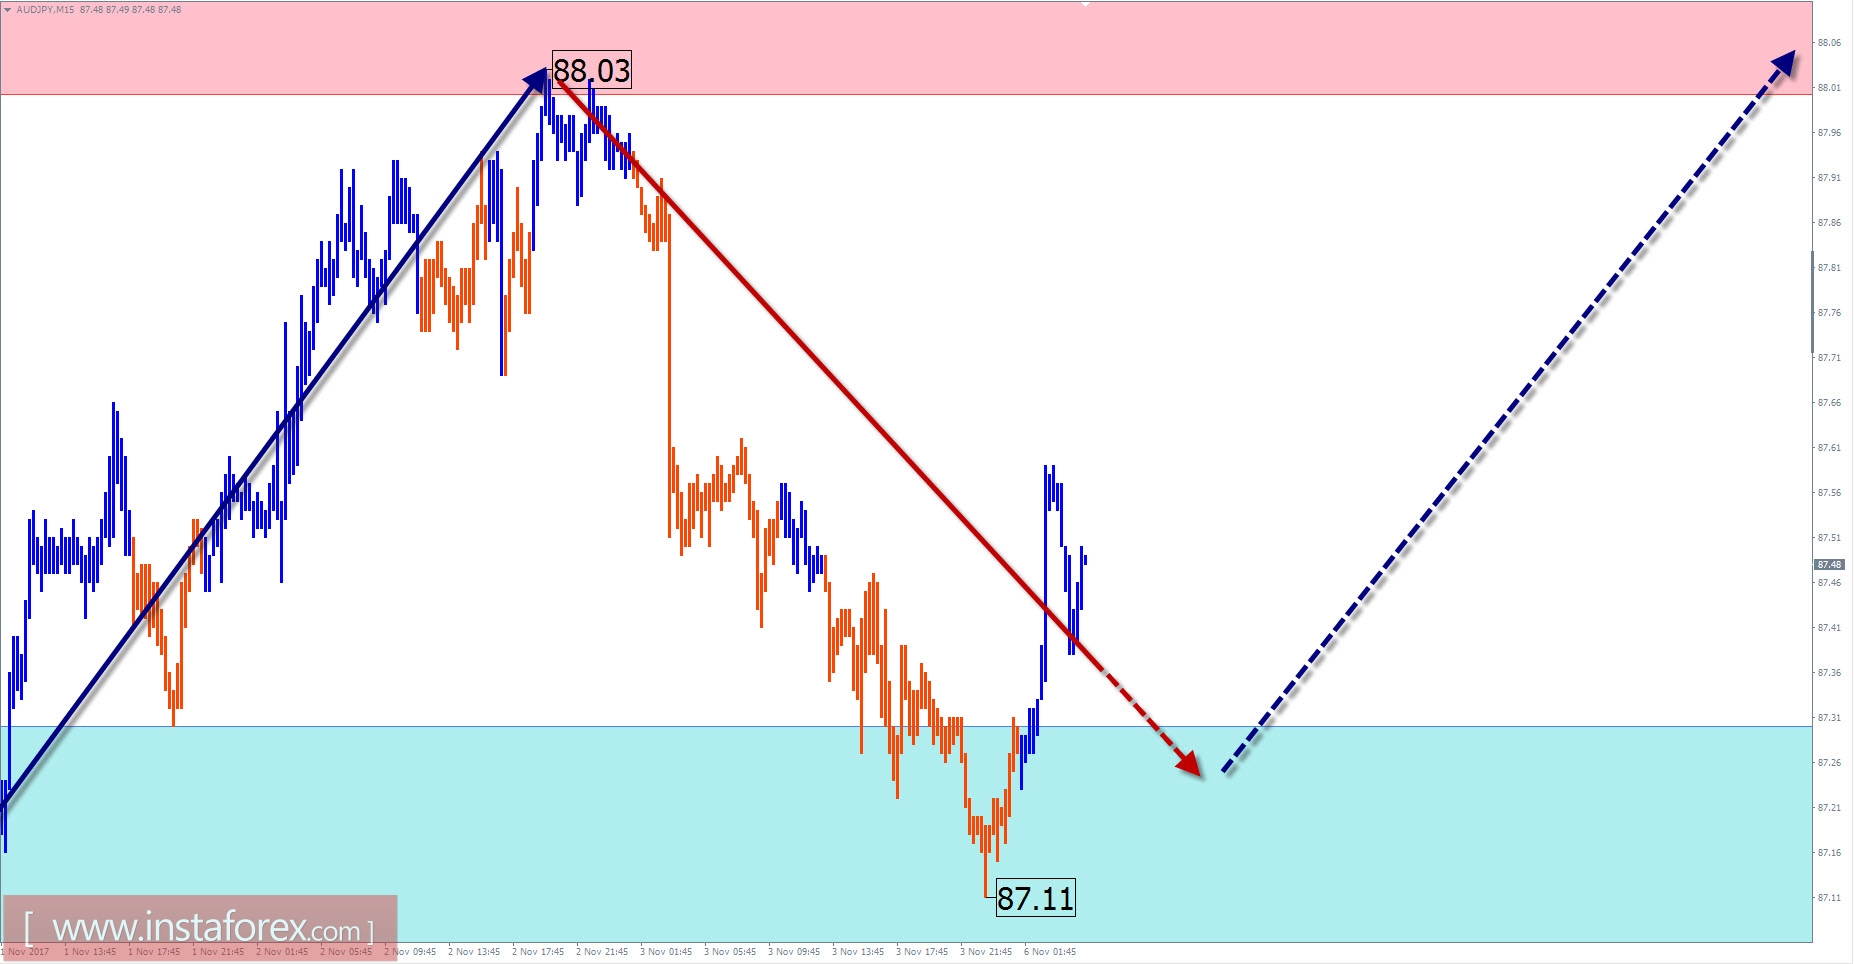
Overview of AUD / JPY with the forecast for the current day
Over the past year and a half, the price of the cross pair is moving upwards. In the wave structure of the monthly chart scale, this area takes place the correction of the final descending wave pattern. The initial estimate of the target level indicates the limited potential for the pair's growth rate.
On a smaller hourly scale, the direction is set by the downward wave of September 21. The structure has formed clearly an expressed zigzag. By the beginning of the current month, the price had reached the upper limit of the potential reversal zone. The growth of prices during the last days forms an upward correction and increase the wave level of the current construction.
Today, the overall upward trend in price fluctuations is highly expected. In the morning, a short-term decline is already ruled out.The resistance zone is the level greatly expected to end the daily volatility.
Boundaries of resistance zones:
- 88.00 / 88.30
Boundaries of support zones:
- 87.30 / 87.00
Explanations to the figures: For simplified wave analysis, a simple waveform is used that combines 3 parts (A; B; C). Of these waves, all kinds of correction are composed and most of the impulses. On each considered time frame the last and incomplete wave is analyzed.
The areas marked on the graphs are indicated by the calculation areas in which the probability of a change in the direction of motion is significantly increased. Arrows indicate the wave counting according to the technique used by the author. The solid background of the arrows indicates the structure formed, the dotted one indicates the expected wave motion.
Attention: The wave algorithm does not take into account the duration of the tool movements in time. The forecast is not a trading signal! To conduct a trade transaction, you need to confirm the signals of your trading systems.
* The presented market analysis is informative and does not constitute a guide to the transaction.


