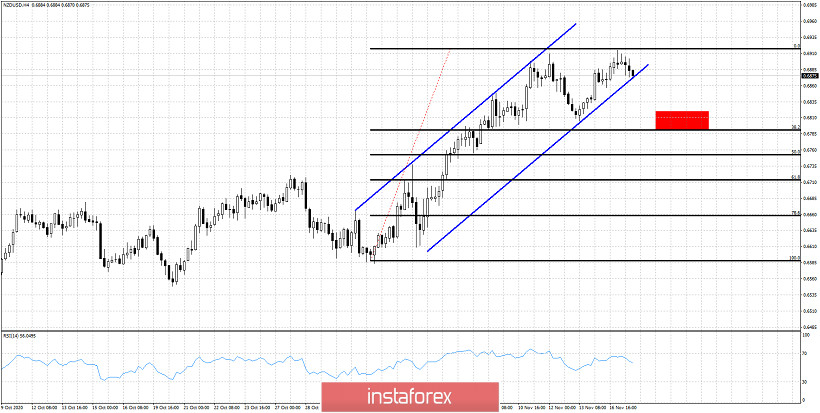
With NZDUSD in a bullish channel and price making higher highs and higher lows, we have confirmation that trend is still bullish. However there are some signs that we should not ignore and they are not very good for bulls.

Red rectangle- first pull back target
Black lines -Fibonacci retracements
NZDUSD despite making a marginal higher high, it looks weak and ready to turn lower. Price is now challenging lower channel boundary support at 0.6875. If the channel is broken we expect price to test the 38% Fibonacci retracement level around 0.6790. The RSI is not following price and is not making higher highs also. This bearish divergence supports our view that a pull back is near. The first target area for a pull back is found at the 38% Fibonacci level. Specially if support at 0.6790-0.6780.


