


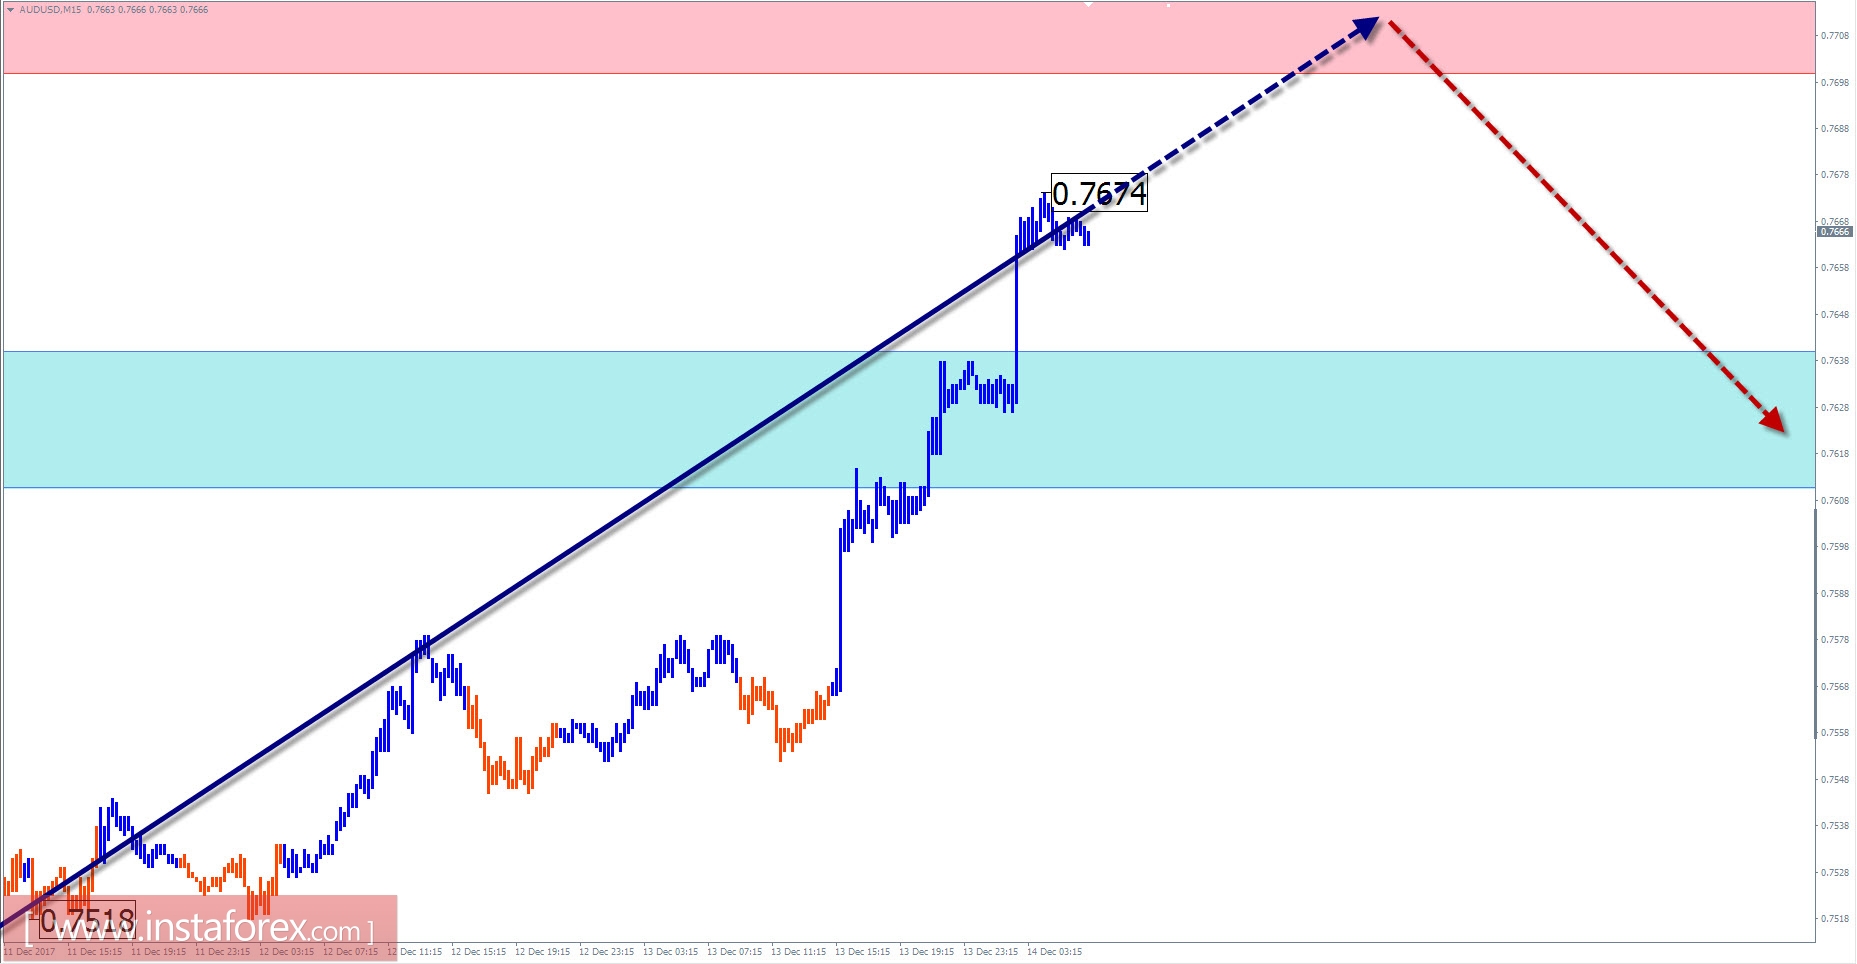
Review and forecast for AUD / USD
The rising price movement of the Australian major currency on the chart over the past 2 years led the quotes into the zone of potential reversal. The decline beginning on September 8 forms a counter wave. Its potential allow to classify the beginning of the movement towards the correction of the previous uptrend. The wave develops according to the impulse scenario. Preliminary calculation of the target zone gives grounds of waiting for further reduction by at least 4 price figures from the current rate.
Within the framework of the described wave, a latent correction is being formed from the end of October. Beginning at the end of last week, the ascending spurt took the place of its final part (C).
Today, the completion of this trend is expected to continue. Most likely, there will be a turn at the calculated resistance zone. The beginning of the next descending phase of the movement could take place tomorrow.
Boundaries of resistance zones:
- 0.7700 / 0.7730
Boundaries of support zones:
- 0.7640 / 10
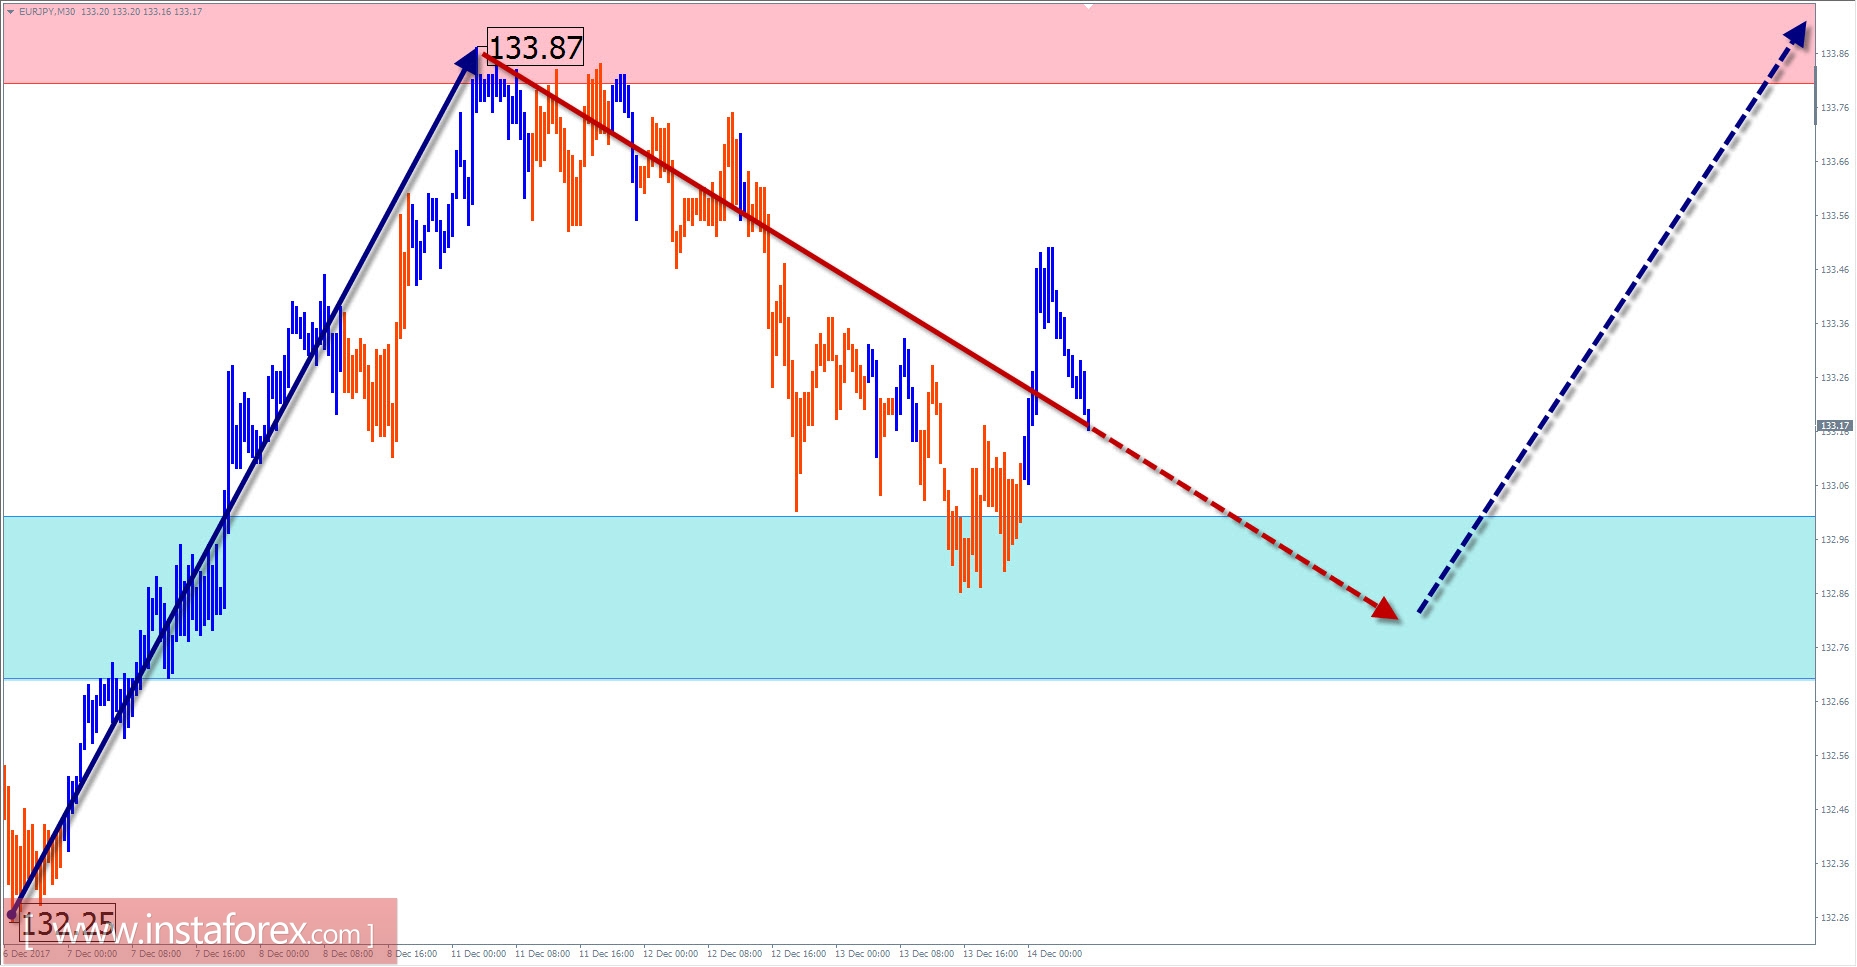
EUR / JPY outlook and outlook
The upward direction of the main wave trend moved to the price levels of 2 years ago. The lower boundary of the target zone is approximately in 6 price figures above the current rate.
From the end of September, the price of the pair forms a correctional plane. It is restricted by a flat boundary of about 3 days' walk. The wave structure does not demonstrate completeness. Its last section can be considered as an ascending zigzag of November 20. It completes the formation of the middle part (B).
The next session is likely to push again the price of the support zone. In the afternoon, the formation of a reversal and the onset of a counter-rise are expected. The active phase of price growth may shift the next day.
Boundaries of resistance zones:
- 133.80 / 134.10
Boundaries of support zones:
- 133.00 / 132.70
Explanations of the figures:
For simplified wave analysis, a simple waveform is used that combines 3 parts namely A, B, and C. All types of correction are created and most of the impulses can be found in these waves. Every time frame is considered and the last incomplete wave is analyzed..
The areas marked on the graphs indicate the probability of a change in the direction of motion has significantly increased as calculated in the areas. Arrows indicate the wave counting following the technique used by the author. A solid background of the arrows signifying the structure has been formed while the dotted one means the expected wave motion.
Attention: The wave algorithm does not take into account the duration of the movement of tools in time. The forecast is not a trading signal! To conduct a bargain, you need to confirm the signals used through your trading systems.


