


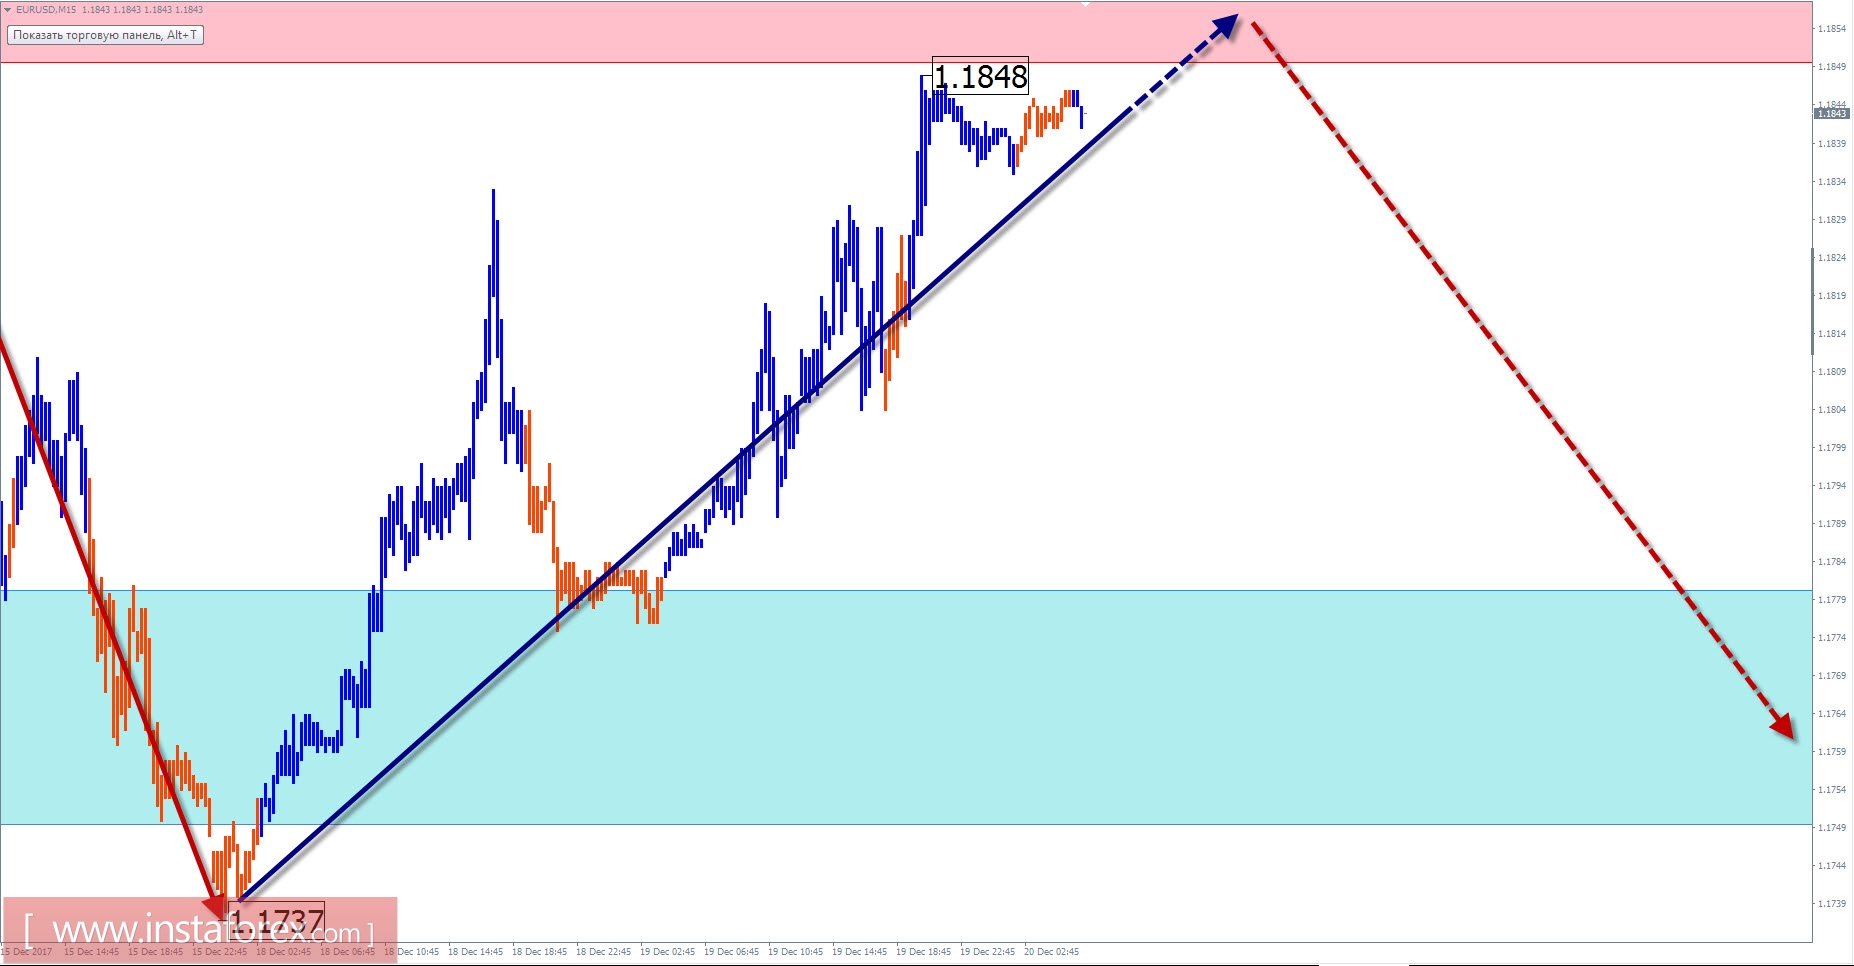
Overview and forecast for EUR / USD
The ascending stretched plane, formed since March 2015, has reached the preliminary target zone. As a result of the price increase in the exchange rate, the quotations of the pair move over the last three months. The structure of the correction does not show completeness, which allows waiting for another decline in the rate in the near future.
As shown on the hourly scale of the chart, the last wave was unfinished at the time of analysis which took off on November 27. The rising quotes have completed the middle part of the construction (B) in the recent days.
In the upcoming trading sessions, the euro is expected to fully complete its upward movement. Next, traders should look out for the formation of the reversal and the beginning of the downward course of the pair.
Boundaries of resistance zones:
- 1.1850 / 80
Boundaries of support zones:
- 1.1780 / 50
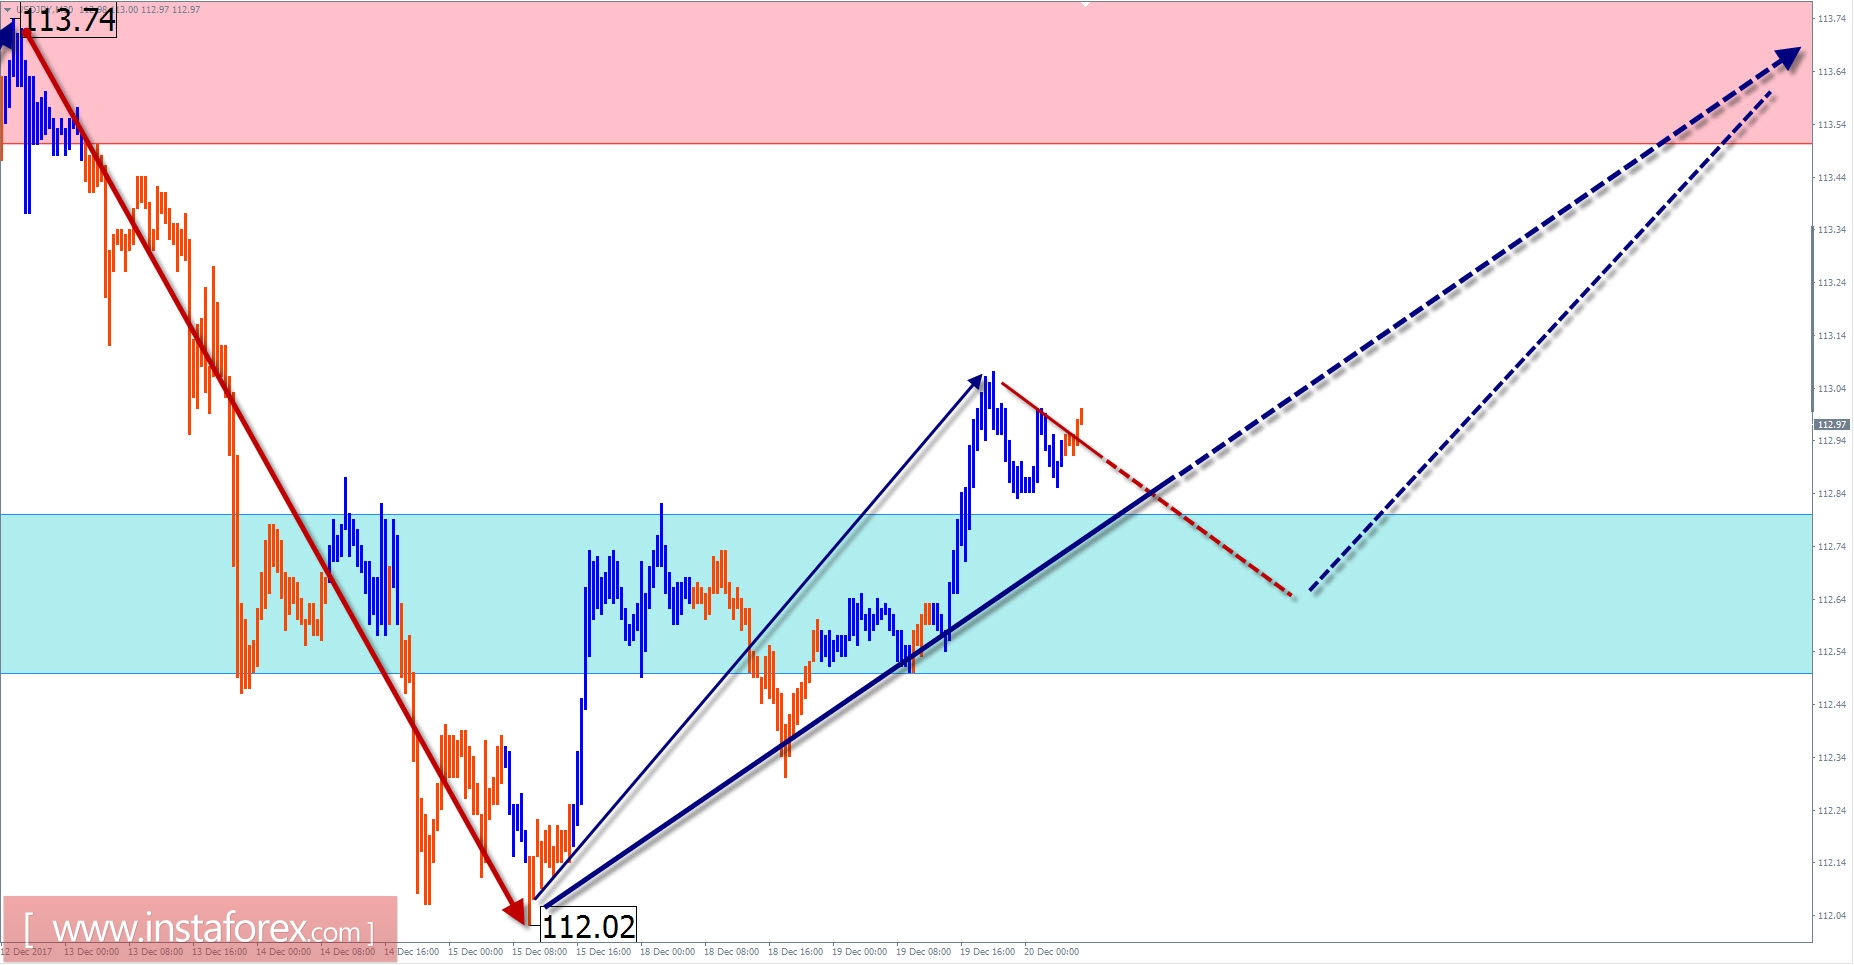
Review and forecast for USD / JPY
Since December last year, the main vector of the price movement of the Japanese yen major currency pair is "outset". The descending wave takes the place of correction and has a high wave potential. Analysis of the structure of the wave shows that the structure from September 8 the middle part (B) develops. After its completion, a new short-term price reduction step will follow.
Today, a general upward adjustment of the fluctuations is expected, with the achievement of the lower limit of the calculated zone in the completion of the recovery. The most likely site for the end of the day's turn is in the area of the marked resistance. In the morning, the probability of a short-term price reduction to the support boundaries is not ruled out.
Boundaries of resistance zones:
- 113.50 / 80
Boundaries of support zones:
- 112.80 / 50
Explanations of the figures:
For simplified wave analysis, a simple waveform is used that combines 3 parts namely A, B, and C. All types of correction are created and most of the impulses can be found in these waves. Every time frame is considered and the last incomplete wave is analyzed.
The areas marked on the graphs indicate the probability of a change in the direction of motion has significantly increased as calculated in the areas. Arrows indicate the wave counting following the technique used by the author. A solid background of the arrows signifying the structure has been formed while the dotted one means the expected wave motion.
Attention: The wave algorithm does not take into account the duration of the movement of tools in time. The forecast is not a trading signal! To conduct a bargain, you need to confirm the signals used by your trading systems.


