


Overview :
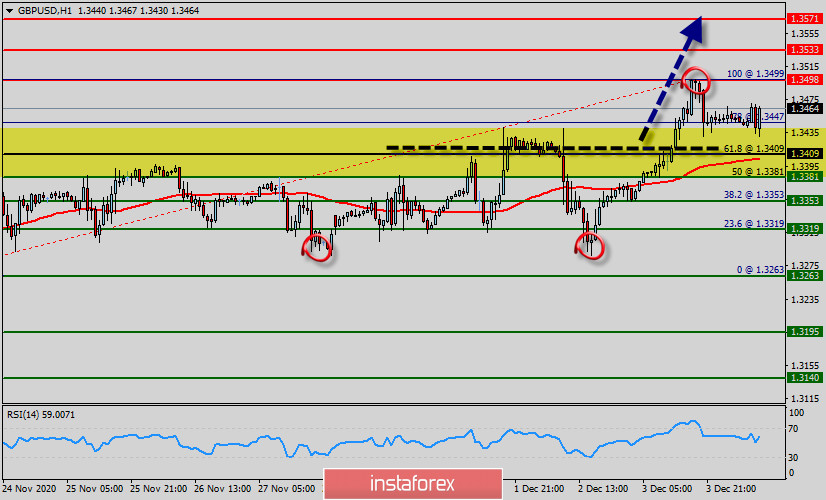
Pivot point : 1.3409 (key level).
The GBP/USD pair sets on major support right now for that we remain bullish. Price is starting to bounce nicely off our major support area starting from 1.3409.
The level of 1.3409 coincides with a golden ratio (61.8% of Fibonacci), which is expected to act as major support today.
The GBP/USD pair moved higher and closed the day in positive area around the 1.3409-1.3381 levels.
The GBP/USD pair will probably continue to rise from the level of 1.3409 in the long term. It should be noted that the support is established at the level of 1.3409 which represents the 61.8% Fibonacci retracement level on the H1 chart.
The price (1.3409) is likely to form a double bottom in the same time frame. Accordingly, the GBP/USD pair is showing signs of strength following a breakout of the highest level of 1.3450.
We expect to see a strong reaction off this level to push price up towards 1.3450 before 1.3409 support.
RSI (14) sees a bullish way out of our ascending support-turned-resistance line signalling that we'll likely be seeing some bearish momentum between the levels of 1.3409 - 1.3498.
This suggests the pair will possibly go up in coming hours. At H4 chart closure above 1.3409 allows the pair to make a quick bullish movement towards the next resistance level around 1.3498.
However, traders should watch for any signs of bearish rejection that occur around 1.3409 - 1.3498. The pivot point stands at 1.3409. The pair is trading above its pivot point. It is likely to trade in a higher range as long as it remains above the pivot point.
Amid the previous events, the pair is still in an uptrend. The GBP/USD pair is continuing in a bullish trend from the new support of 1.3409.
Buy above the level of 1.3409 with the first target at 1.3498 in order to test the daily resistance 1 and further to 1.3533.
Also, it might be noted that the level of 1.3571 is a good place to take profit because it will form a new double top. Please check out the market volatility before investing, because the sight price may have already been reached and scenarios might have become invalidated.
On the other hand, in case a reversal takes place and the GBP/USD pair breaks through the support level of 1.3409, a further decline to 1.3319 can occur which would indicate a bearish market.
Forecast :
If the pair fails to pass through the level of 1.3409, the market will indicate a bullish opportunity above the strong support level of 1.3409. Buyers are bidding for a low price. In this regard, buy deals are recommended lower than the 1.3409 level with the first target at 1.3498. The trend is still calling for a strong bullish market from the spot of 1.3409. It is possible that the pair will turn upwards continuing the development of the bullish trend to the level 1.3533, then towards next objective 1.3571. However, stop loss has always been in consideration thus it will be useful to set it above the last bearish wave at the level of 1.3319 (notice that the major support today has set at 1.3319).


