


The dollar has been in retreat mode against many of the major currencies, but hasn't lost much against the AUD, as investor appetite for risk has been strong, at the expenditure of the safe-haven dollar and AUD.
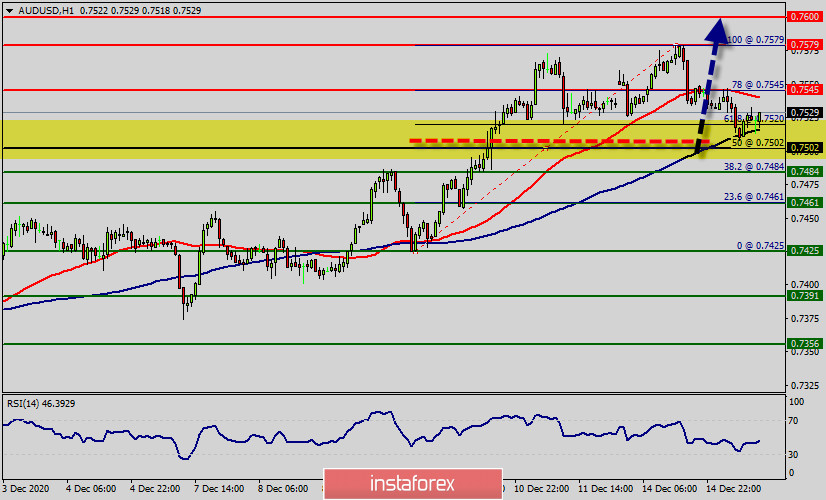
The USD/AUD pair touched the upwards range's support line at 0.7502 and bounced upwards clearly from there, to head towards potential test to this range's resistance at 0.7545 in the upcoming sessions, to keep the upwards range dominant on the intraday trades until the price manages to surpass one of the mentioned levels.
Price is seeing strong support above 0.7502 (50% of Fibonacci retracement, horizontal overlap support) and we expect to see a strong bounce above this level to push price up to at least 0.7545, then 0.7579 resistance (top point, horizontal swing high resistance). We have to watch out for the descending line which would pose as intermediate resistance to this move.
The US dollar has rallied a bit during the week to reach towards the 1.7525 level. Moreover, the market has went forward significantly from there, which makes quite a bit of sense considering that we have been in a strong uptrend.
The USD/AUD pair broke resistance which turned to strong support at the level of 0.7502 this week. The level of 0.7502 coincides with 50% of Fibonacci, which is expected to act as major support today. Also, it should be noticed that, the level of 0.7502 represents the daily pivot point.
Since the trend is above the 50% Fibonacci level, the market is still in an uptrend. From this point, the USD/AUD pair is continuing in a bullish trend from the new support of 0.7502.
Currently, the price is in a bullish channel. According to the previous events, we expect the 0.7502 pair to move between 0.7502 and 0.7579.
On the H1 chart, resistance is seen at the levels of 0.7545, 0.7579 and 0.7600.
Therefore, strong support will be formed at the level of 0.7502 providing a clear signal to buy with the targets seen at 0.7545. If the trend breaks the reisstance at 0.7545 (first resistance) the pair will move upwards continuing the development of the bullish trend to the level 0.7579 in order to test the daily resistance 2. then the trend will continue towards the third resistance of 0.7600.
However, the stop loss should always be taken into account, for that it will be reasonable to set your stop loss at the level of 0.7461.
Conclusion:
It should be noted that the support is established at the level of 0.7502. The price is likely to form a double bottom in the same time frame. Accordingly, the USD/AUD pair is showing signs of strength following a breakout of the highest level of 0.7502. So, buy above the level of 0.7502 with the first target at 0.7545 in order to test the daily resistance 1 and further to 0.7579. Also, it might be noted that the level of 0.7579 is a good place to take profit because it will form a double top. If the pair succeeds to pass through the level of 0.7579, the market will indicate a bullish opportunity above the level of 0.7579 - next target 0.7600.


