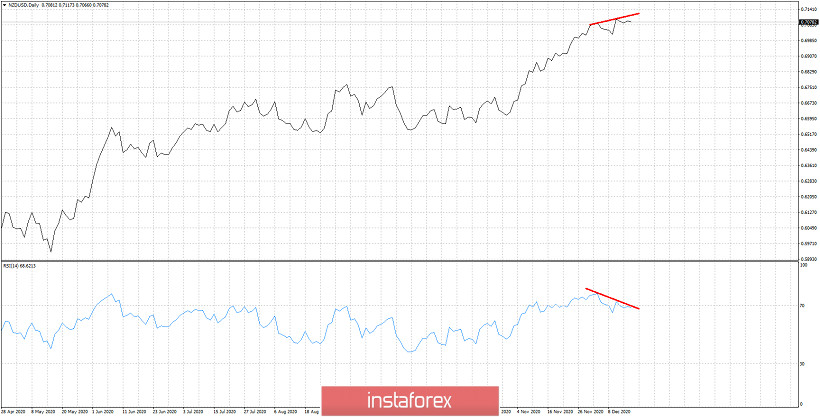
NZDUSD remains in a bullish trend as price is making higher highs and higher lows. In the Daily chart the RSI has not followed price to a new higher high and this is a bearish divergence. This is not a reversal sign but only a warning. Traders need to be very cautious if long.

NZDUSD has not made any considerable pull back since September. The RSI in the Daily chart is at overbought levels and turning lower. Combined with a lower high in the RSI while price is making higher highs we expect a reversal to occur soon. The pull back will be confirmed if and when price breaks below 0.70. The pull back target would be around 0.69 and maybe 0.6750. Bulls need to be very cautious.


