Overview :
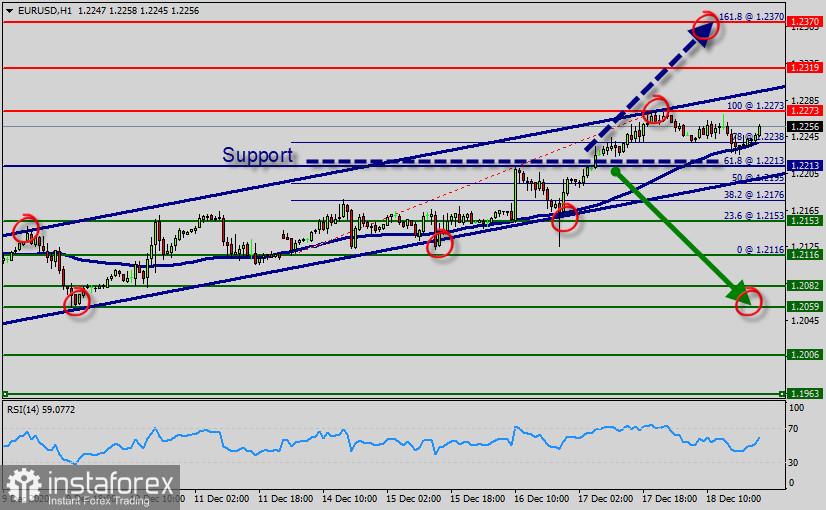
- Pivot : 1.2213.
The EUR/USD pair faced resistance at the level of 1.2319, while minor resistance is seen at 1.2273. Support is found at the levels of 0.9800 and 0.9660.
The price of 1.2213 represents the daily pivot point (key level, 61.% of Fibonacci retracement level, support/resistance at the same time).
Also, it should be noted that a daily pivot point has already set at the level of 1.2213. Equally important, the EUR/USD pair is still moving around the key level at 1.2213, which represents a daily pivot in the H1 time frame at the moment.
Last week, the EUR/USD pair continued to move upwards from the level of 1.2153. The pair rose from the level of 1.2153 (this level of 0.9800 coincides with the double bottom, 23.6% Fibonacci retracement level) to the top around 1.2273. The EUR/USD had rebounded from the highest price of 1.2273 to close at 1.2235.
In consequence, the EUR/USD pair broke resistance, which turned strong support at the level of 1.2223. The level of 1.2223 is expected to act as major support today. From this point, we expect the EUR/USD pair to continue moving in the bullish trend from the support level of 1.2223 towards the target level of 1.2273. If the pair succeeds in passing through the level of 1.2273, the market will indicate the bullish opportunity above the level of 1.2273 in order to reach the second target at 1.2319.
However, if the pair fails to pass through the level of 1.2273, the market will indicate a bearish opportunity below the level of 1.2273. So, the market will decline further to 1.2223 in order to return to the daily pivot point (1.2223). Moreover, a breakout of that target will move the pair further downwards to 1.2059 in coming days.
Forecast :
Uptrend scenario :
- An uptrend will start as soon, as the market rises above support level 1.2213, which will be followed by moving up to resistance levels of 1.2273, 1.2319, then 1.2370.
Downtrend scenario :
- An downtrend will start as soon, as the market drops below support level 1.2223 , which will be followed by moving down to support level 1.2059.
Tips :
- Important tips to remember about trend lines:
- When constructing a channel, both trend lines must be parallel lines to each other. Predominantly, the bottom of channel is considered a buy area while the top of channel is considered a sell area. Like in drawing trend lines, do not ever force the price to the channels that you draw! A channel limit that is slanting at one angle while the corresponding (parallel) channel limit is slanting at another is not correct and could lead to bad trades. Channels are just another tool in technical analysis which can be used to determine good places to buy or sell. Both the tops and bottoms of channels represent potential areas of support or resistance.