Overview :
British Pound / U.S. Dollar
The momentum seems strong enough to push the pair further beyond the 1.3624 mark, towards testing last week's swing highs, around the 1.3624 region.
The market called for a very bullish price action. Overall bullish market about to rush towards previous highs.
Further close above the high end may cause a rally towards 1.3624. Nonetheless, the weekly resistance level and zone should be considered.
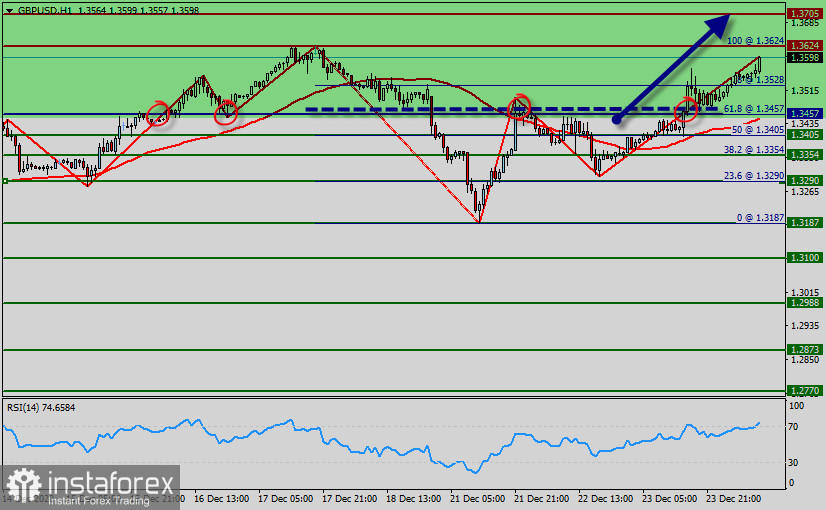
The GBP/USD pair continues to move upwards from the level of 1.3457.
Today, the first support level is currently seen at 1.3457, the price is moving in a bullish channel now.
Besides, the price has set above the strong support at the level of 1.3457, which coincides with the 61.8% Fibonacci retracement level. This support has been rejected three times confirming the veracity of an uptrend.
According to the previous events, we expect the GBP/USD pair to trade between 1.3457 and 1.3705. So, the support stands at 1.3457, while daily resistance is found at 1.3624.
Therefore, the market is likely to show signs of a bullish trend around the spot of 1.3528.
As result, the price spot of 1.3457/1.3528 remains a significant support region.
Consequently, there is a possibility that the GBP/USD pair will move upside and the structure of a fall does not look corrective. In order to indicate the bearish opportunity above the levels of 1.3457 and 1.3528, buy above below 1.3457 or 1.3528 with the first target at 1.3624 in order to test last week's top.
Additionally, if the GBP/USD pair is able to break out the top at 1.3624, the market will decline further to 1.3705 so as to test the weekly resistance 21 in coming 48 hours.
However, if the GBP/USD pair fails to break through the resistance level of 1.3624 today, the market will decline further to 1.3457.


