


The major European currency chart continues the algorithm of the rising wave model. The quotations are in the framework of a potential reversal zone. The pair spent the whole last month in the side flute, forming an intermediate pullback. The structure of the current trend wave does not show completeness, so the reversal from current levels should not be expected.
A week ago, a new wave zigzag began in the direction of the main trend. The nature of the price movement in this wave is close to the momentum.
Today, in the morning, the price expects a lateral flat, possibly with a descending vector. Toward the end of the day, one can expect an increase in the volatility of the pair and the price move upwards.
The boundaries of resistance zones:
- 1.2470 / 1.2500
The boundaries of support zones:
- 1.2390 / 60
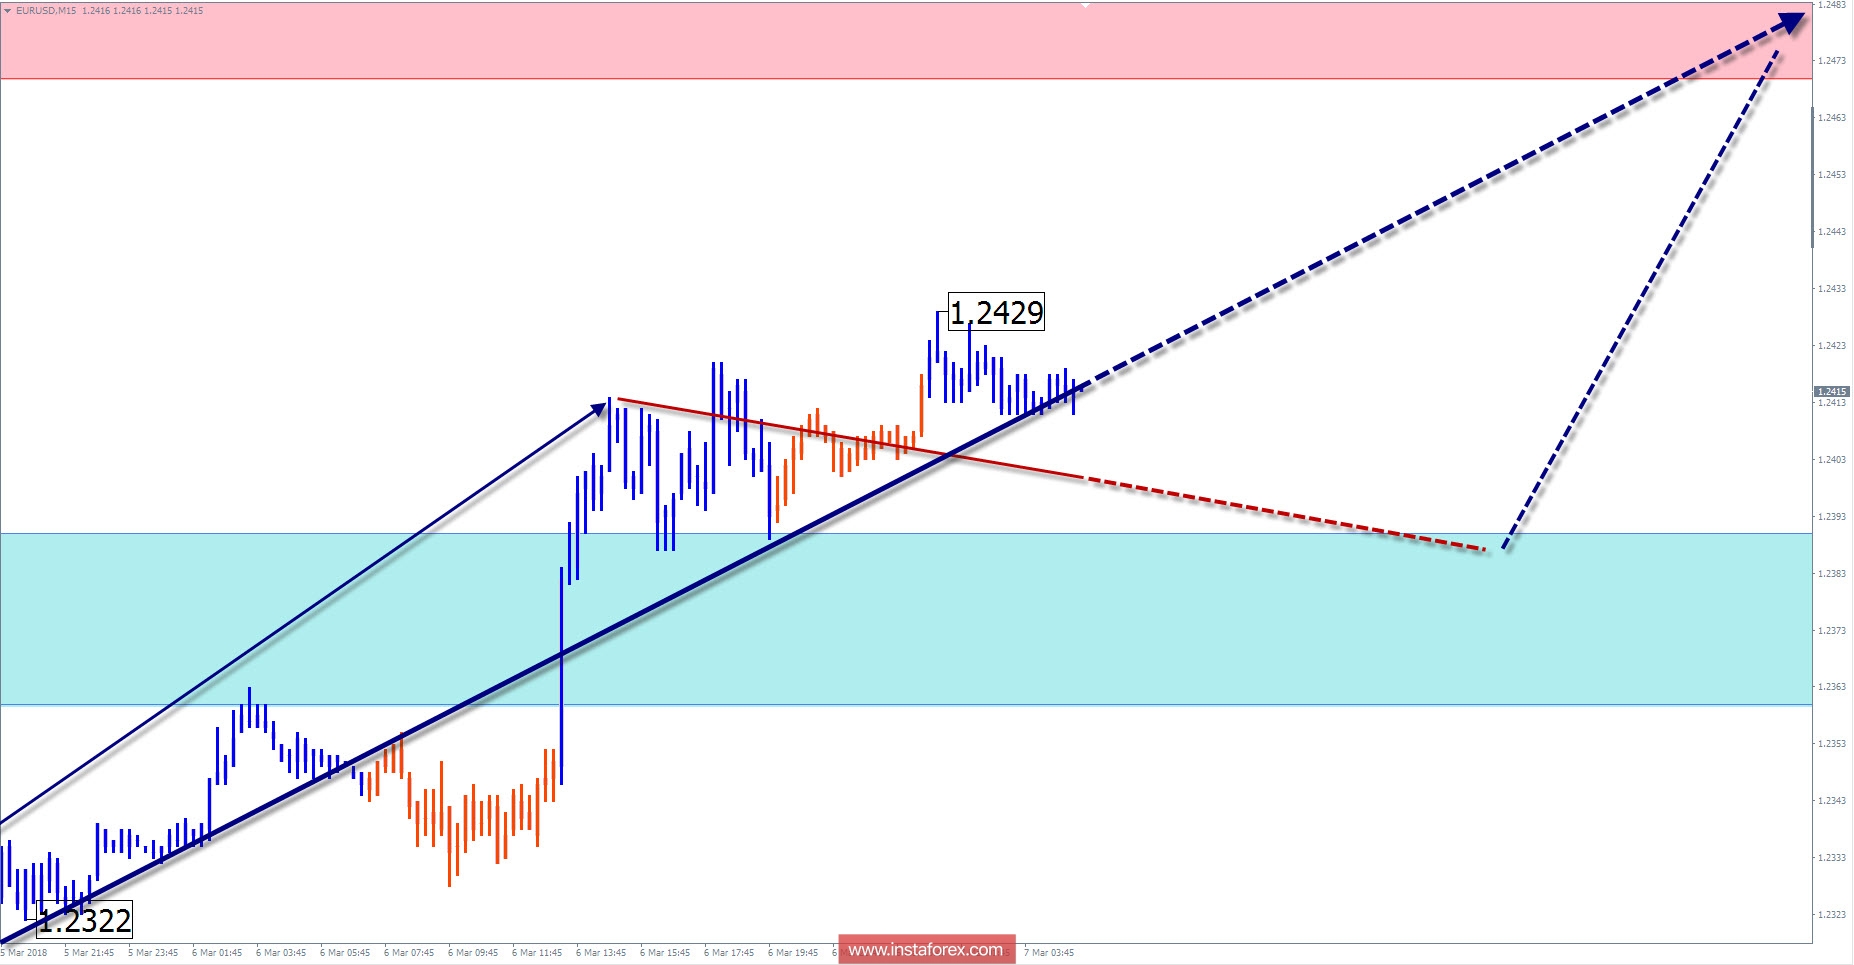
Explanations to the figures: For simplified wave analysis, the simplest type of wave is used in the form of a zigzag, combining 3 parts (A; B; C). Of these waves, all kinds of correction are composed and most of the impulses. At each time frame, the last, incomplete wave is analyzed.
The areas marked on the graphs are indicated by the calculation areas, where the probability of a change in the direction of motion is significantly increased. Arrows indicate the wave counting according to the technique used by the author. The solid background of the arrows indicates the structure formed, the dotted one indicates the expected wave motion.
Attention: The wave algorithm does not take into account the duration of the tool movements in time. The forecast is not a trading signal! To conduct a trade transaction, you need to confirm the signals of your trading systems.


