


The rising wave since December 2016 sets the major European currency major. In a larger wave model, it takes the place of the final part (C). The analysis of the structure indicates the incompleteness of the entire structure.
Since January, the price is in the framework of a large resistance zone, forming a lateral flat section on the chart. The bear area has little potential for travel, so its target zone is in the area of the support zone.
In the upcoming trading sessions, you can count on a short-term price rise, within the daily course of the pair. In the following days, the price is expected to change course and re-decline. Within the support zone, the entire correction wave is expected to be completed.
The boundaries of resistance zones:
- 1.2390 / 1.2440
The boundaries of support zones:
- 1.2160 / 1.2110
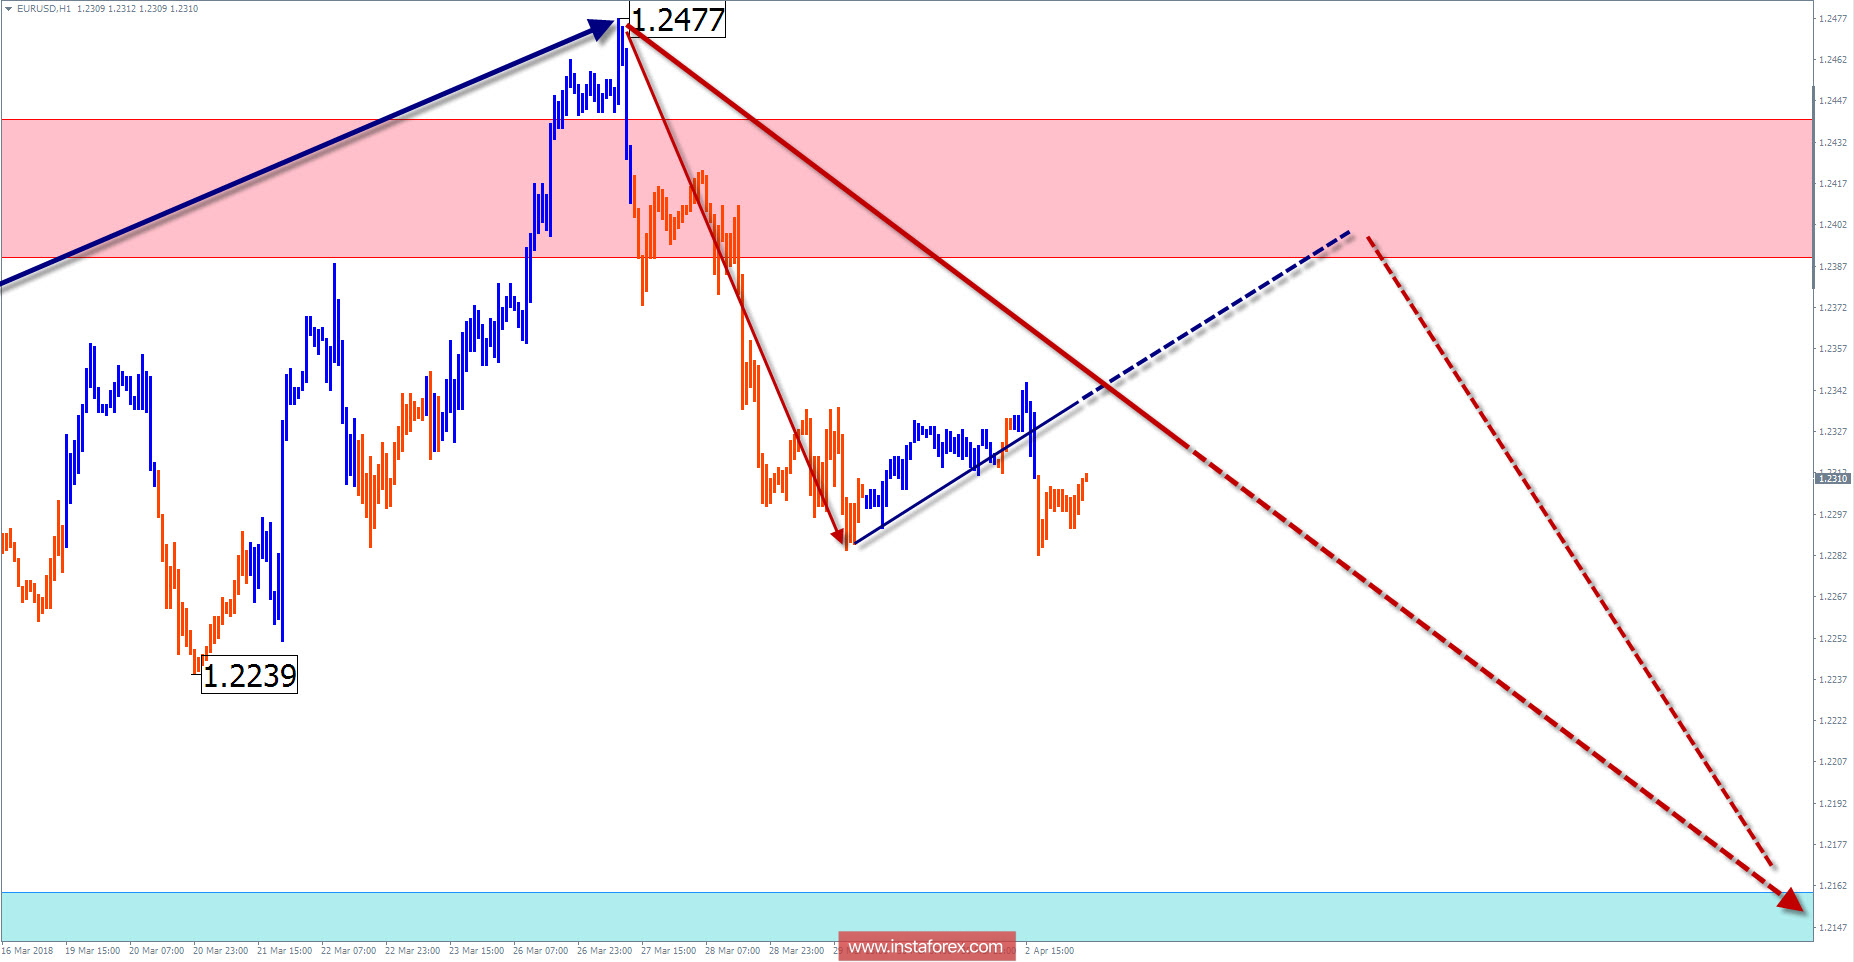
Explanations to the figures: For simplified wave analysis, the simplest type of wave is used in the form of a zigzag, combining 3 parts (A; B; C). Of these waves, all kinds of correction are composed and most of the impulses. At each time frame, the last, incomplete wave is analyzed.
The areas marked on the graphs are indicated by the calculation areas, where the probability of a change in the direction of motion is significantly increased. Arrows indicate the wave counting according to the technique used by the author. The solid background of the arrows indicates the structure formed, the dotted one indicates the expected wave motion.
Attention: The wave algorithm does not take into account the duration of the tool movements in time. The forecast is not a trading signal! To conduct a trade transaction, you need to confirm the signals of your trading systems.


