


Earlier this year, the chart of AUD/JPY cross pair showed a steady decline in its price. The pattern of the graph was the final part of the correction of a larger scale. The preliminary calculation of its potential indicates the possible continuation of the current rate decline up to the minimum extremes of June 2016.
The quotes of the pair in the recent weeks are in the intermediate support zone. Reaching this level triggered a sideways rollback which does not have a reversal potential.
In the coming days, the ascending part of the trend must complete its formation. The upper limit of the flat is the formed resistance. By the end of the week, a change in direction is expected along with a return to the prevailing direction.
Boundaries of resistance zones:
- 82.20 / 82.70
Boundaries of support zones:
- 80.40 / 79.90
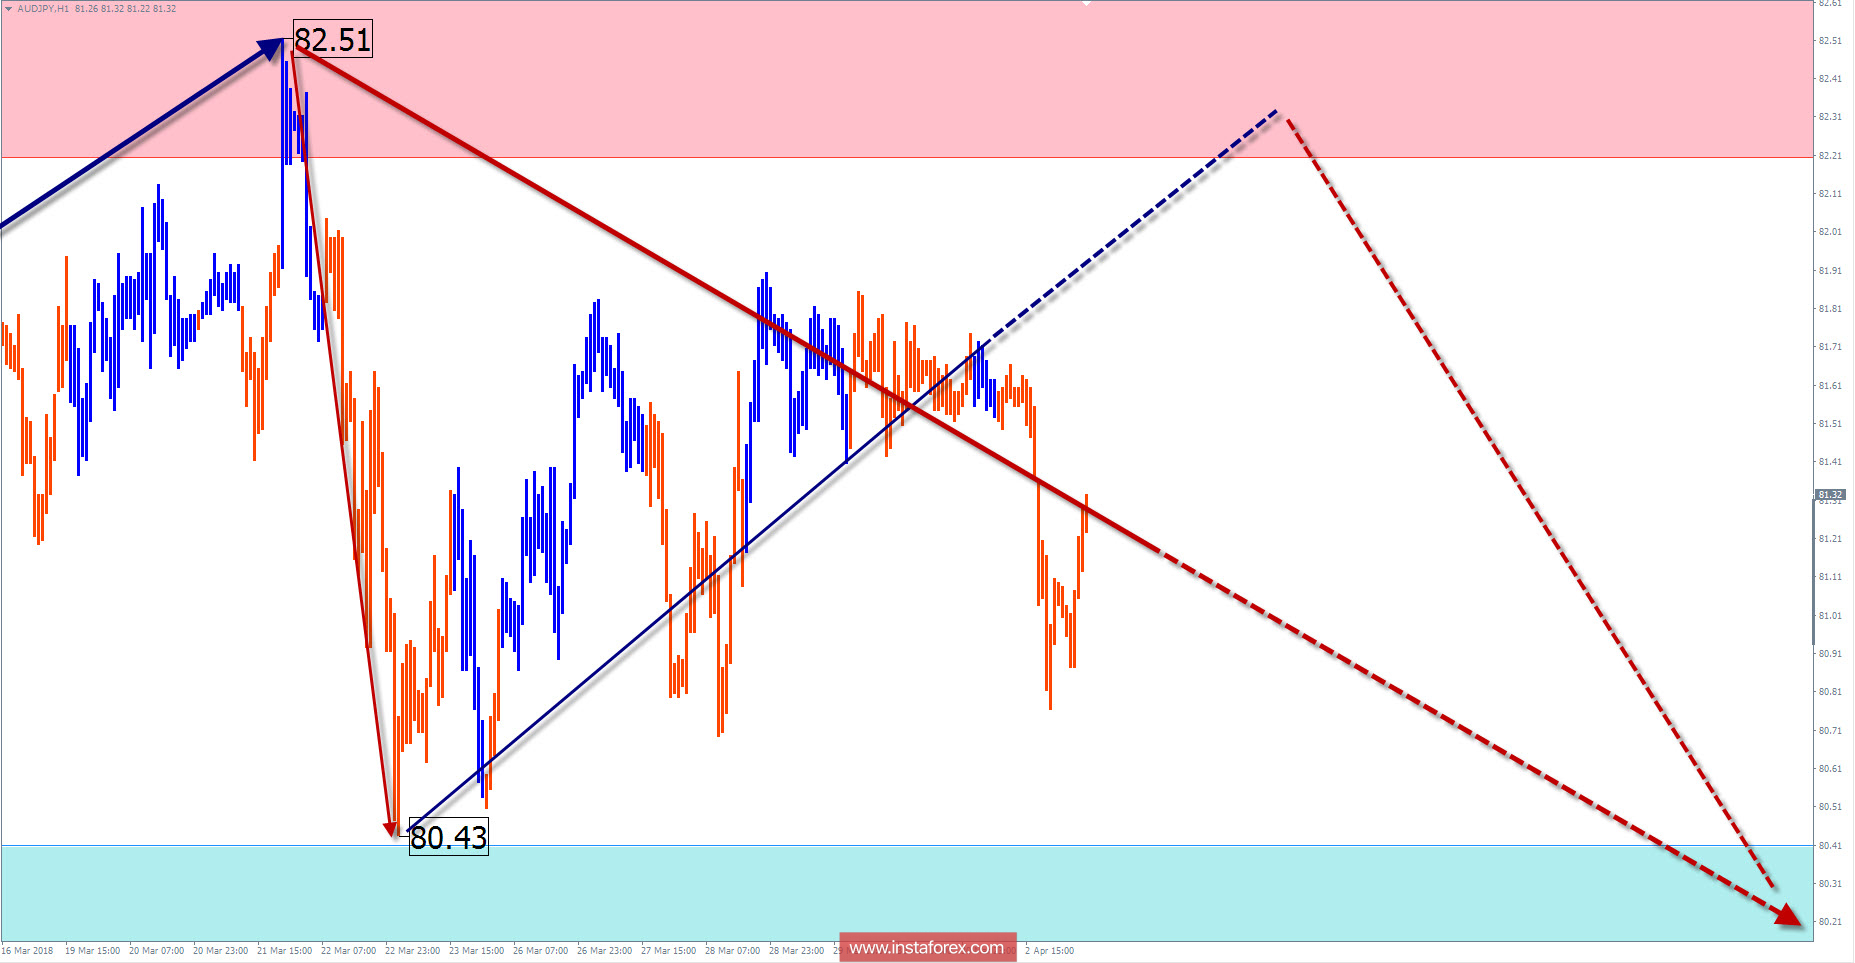
Explanations to the figures: For simplified wave analysis, the simplest type of wave is used in the form of a zigzag, combining 3 parts (A; B; C). Of these waves, all kinds of correction are composed and most of the impulses. At each time frame, the last, incomplete wave is analyzed.
The areas marked on the graphs are indicated by the calculation areas, where the probability of a change in the direction of motion is significantly increased. Arrows indicate the wave counting according to the technique used by the author. The solid background of the arrows indicates the structure formed, the dotted one indicates the expected wave motion.
Attention: The wave algorithm does not take into account the duration of the tool movements in time. The forecast is not a trading signal! To conduct a trade transaction, you need to confirm the signals of your trading systems.
* The presented market analysis is informative and does not constitute a guide to the transaction.


