


EUR/USD
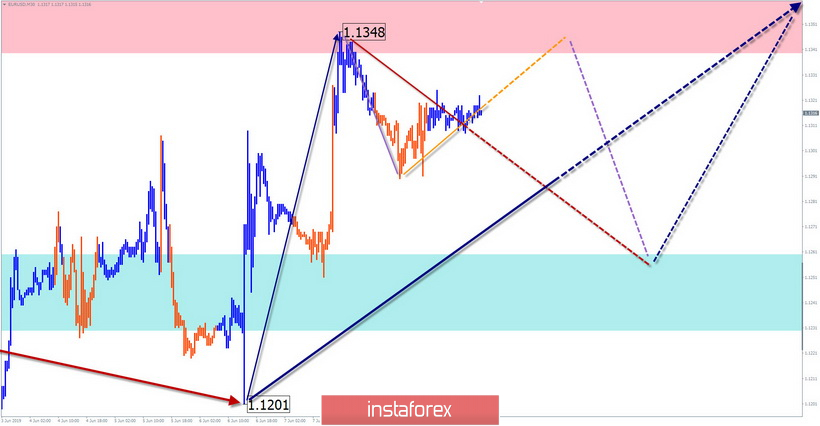
The bullish wave of May 23 has a sufficient wave level to give rise to a new short-term trend. The price is at the bottom of a wide potential reversal zone. Since June 6, the bearish correction began to form in the wave structure.
Forecast:
Today, the upward pullback, which began yesterday, is expected to be completed, given the generally flat nature of the movements. Breaking the upper limit of resistance is unlikely. Further, the formation of a reversal and the beginning of a price decline is expected. The most likely lower limit of daily volatility is the support zone.
Recommendations:
Euro purchases today should be made with small upside potential. Short-term sales of the instrument are possible upon confirmation of the exchange rate change. The most reasonable tactic is to wait out the correction stage outside the market.
Resistance zone:
- 1.1340/1.1370
Support zone:
- 1.1260/1.1230
AUD/USD
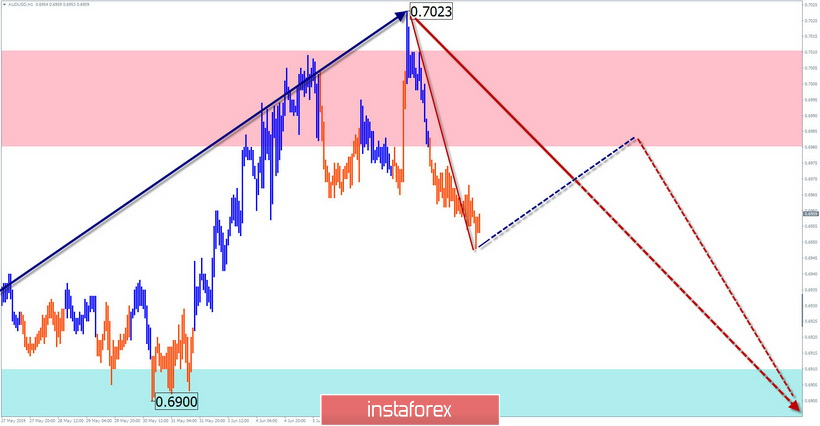
The Australian dollar major chart is dominated by a bearish trend. The bullish wave from May 17, which sets the vector to the direction of interday price fluctuations, is a correction of its last section. The wave reached a strong resistance. The decline that began on June 8 has a reversal potential, which indicates an early change in the price movement of the pair.
Forecast:
In the next trading sessions, the flat mood of the price movement is most likely. In the first half of the day, an upward vector of oscillations is expected; by the end of the day, the probability of a turn and the beginning of a decline increase. At the beginning of the descending phase, the volatility of movements can sharply increase.
Recommendations:
Buy "Aussie" today is unpromising, due to the low expected turn-up. In the area of the calculated resistance, it is recommended to start tracking your vehicle's signals to sell the instrument.
Resistance zone:
- 0.6980/0.7010
Support zone:
- 0.6910/0.6880
GBP/JPY
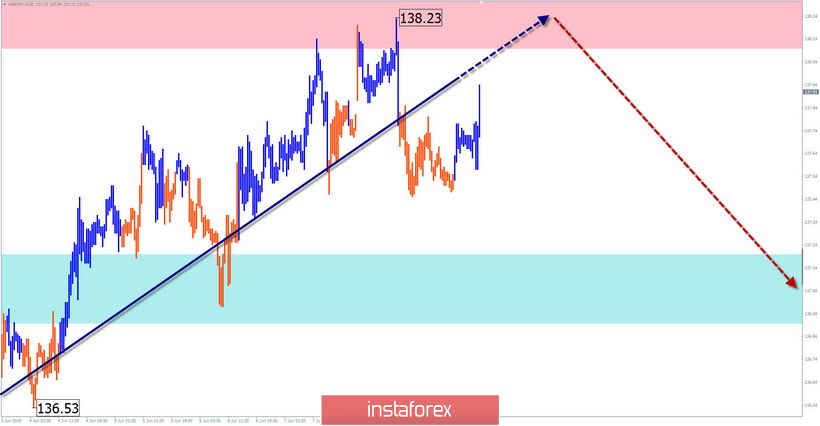
On the cross chart against the general downward trend stands out bullish area from May 31. According to its potential, it takes the place of correction of the last section of the main wave. The wave structure looks complete. The price is approaching the lower limit of a wide potential reversal zone of a large scale.
Forecast:
Today, the upward trend of the price movement is expected to continue until its full completion. Further, it is expected to change the rate of movement and the price move of the pair down. Before the change, of course, the probability of a short-term break of the upper limit of the resistance zone remains.
Recommendations:
When buying a cross, the probability of a deep counter-rollback of the price should be taken into account. More promising may be the sale of the instrument, tracked in the area of the calculated resistance zone.
Resistance zone:
- 138.10/138.40
Support zone:
- 137.20/136.90
Explanations to the figures: Waves in the simplified wave analysis consist of 3 parts (A-B-C). The last unfinished wave is analyzed. Zones show areas with the highest probability of reversal. The arrows indicate the wave marking according to the method used by the author, the solid background is the formed structure, the dotted ones are the expected movements.
Note: The wave algorithm does not take into account the duration of tool movements over time.


