


4-hour timeframe
The amplitude of the last 5 days (high-low): 86p - 39p - 38p - 29p - 102p.
Average amplitude for the last 5 days: 59p (44p).
After the collapse on Wednesday, the EUR/USD pair behaved more calmly on Thursday. Traders calmed down after Jerome Powell's statements and focused on the publication of reports on business activity in the manufacturing areas of the European Union and the United States. However, these reports could be interpreted in different ways. In the eurozone, the business activity index rose by a "whole" 0.1 points, from 46.4 to 46.5. On the one hand, improvement, on the other, any value below 50.0 is regarded as negative. In the US, the Markit index exceeded the forecast and amounted to 50.4, while the ISM index turned out to be worse than the expectations of the foreign exchange market and fell to 51.2 in July, but the value of both indices was above 50.0. Thus, it can still be concluded that US business activity in industry remains in the "green zone", while it is in the "red" zone in the eurozone. However, it was the weakened business activity index of ISM that caused minimal cuts in "dollar" positions during the US trading session on Thursday, August 1. Well, now we need to find out whether this will be the beginning of the correction and how strong this correction will be. It is possible that there will be no pullback at all, since we do not even have one closed bullish bar at the moment. However, the euro/dollar pair's rebound from the support level of 1.1028 still allows us to expect a slight pullback. The Fed meeting is in the past and now traders can "live" without any tension until the next ECB and Fed meetings, analyzing only regular macroeconomic reports and regular speeches and publications of Donald Trump, who is constantly dissatisfied with something.
Trading recommendations:
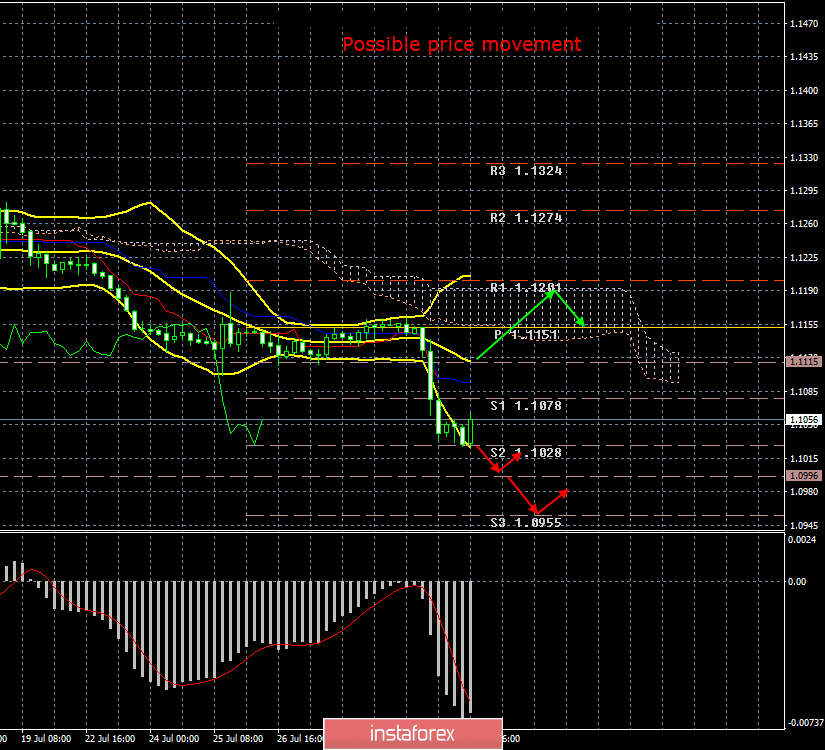
EUR/USD has moved to a weak upward correction. Thus, it is now recommended to wait for its completion and re-sell the euro currency with targets of 1.1028 and 1.0996.
It will be possible to buy the euro/dollar pair with the aim of the upper limit of the Ichimoku cloud, but with small lots, if traders manage to overcome the critical Kijun-sen line. However, bulls remain extremely weak at this time.
In addition to the technical picture should also take into account the fundamental data and the time of their release.
Explanation of the illustration:
Ichimoku indicator:
Tenkan-sen - the red line.
Kijun-sen - the blue line.
Senkou Span A - light brown dotted line.
Senkou Span B - light purple dotted line.
Chikou Span - green line.
Bollinger Bands indicator:
3 yellow lines.
MACD Indicator:
Red line and histogram with white bars in the indicator window.


