


To open long positions on EURUSD, you need:
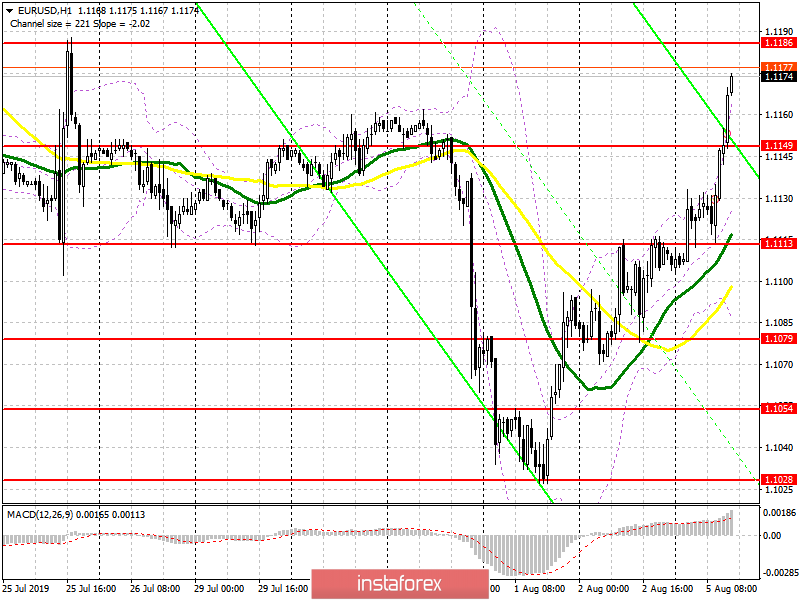
The growth of the European currency continued as expected. I pointed this out in my morning forecast. Even weak reports on the decline in activity in the service sector in Germany and the eurozone failed to put serious pressure on the pair, which indicates the presence of a major player in the market. Now, buyers are seeking the resistance of 1.1186, where today I recommend taking the profit. However, in the scenario of weak data on the ISM index for the non-manufacturing sector in the US, the growth of EUR/USD may continue, which will lead to an update of the maximum of 1.1218. The main task of the bulls for the second half of the day will also be to hold the level of 1.149, the test of which can occur in the case of a good report on the US service sector. However, it is best to open long positions from this level when forming a false breakout.
To open short positions on EURUSD, you need:
Bears failed to cope and retreated after breaking the resistance level of 1.1152, which led to the demolition of a number of stop orders and further upward trend of the euro, even against the backdrop of weak reports on activity in the service sector of the eurozone. At the moment, the main focus of the sellers will be on holding the resistance level of 1.1186, to which the EUR/USD pair can reach after the ISM report for the non-manufacturing sector of the United States. If the data is better than economists' forecasts, sellers of the euro will try to return to the support level of 1.1149, as well as to gain a foothold below this range, which will be a clear signal for the "collapse" of the upward correction in the short term. With the growth of the euro above the resistance of 1.1186 in the second half of the day, you can open short positions immediately on the rebound from the maximum of 1.1218.
Indicator signals:
Moving Averages
Trading is above 30 and 50 moving averages, which indicates the continuation of the upward correction.
Bollinger Bands
In the case of a downward movement, support will be provided by the average border of the indicator to the area of 1.1125.
Description of indicators
- MA (moving average) 50 days – yellow
- MA (moving average) 30 days – green
- MACD: fast EMA 12, slow EMA 26, SMA 9
- Bollinger Bands 20


