


To open long positions on GBP/USD, you need:
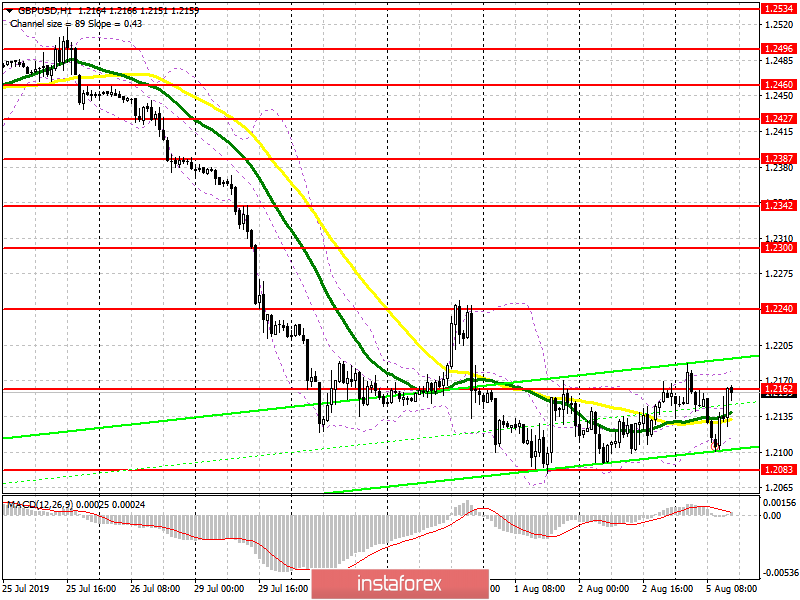
Buyers of the pound failed to hold the resistance of 1.2162 in the morning, which led to a small movement down to the support area of 1.2083, which was not updated. This suggests that the bulls simply decided to take advantage of lower prices and returned to the market, not letting the pair get to very important support at this year's low. At the moment, given that important reports on the UK are not coming out today, but the ISM data for the non-manufacturing sector of the United States are expected, the bulls will re-test and break the important resistance of 1.2162, which will open a real opportunity to update the maximum of 1.2240, where I recommend fixing the profit. In the scenario of further decline of GBP/USD, it is best to return to long positions if a false breakout is formed in the support area of 1.2083, or already on the rebound from the new lows in the area of 1.2040 and 1.1985.
To open short positions on GBP/USD, you need:
Sellers made an attempt today to reduce the support test of 1.2083, but they did not manage to reach it. As noted in the morning forecast, only its breakthrough will strengthen the bearish trend and lead to an update of the lows of 1.2040 and 1.1985, where I recommend taking the profit. However, we should not forget that the data on the US service sector may be much worse than the forecasts, which will force to fix the profit in the US dollar, and this will lead to an upward correction in GBP/USD and to a breakthrough in the resistance of 1.2162. In this scenario, it is best to count on short positions after the test of the maximum of 1.2240, which was formed at the beginning of the last week.
Indicator signals:
Moving Averages
Trading is conducted in the area of 30 and 50 moving averages, which indicates the lateral nature of the market.
Bollinger Bands
The break of the upper limit of the indicator in the area of 1.2175 may lead to a larger upward correction in the British pound.
Description of indicators
- MA (moving average) 50 days – yellow
- MA (moving average) 30 days – green
- MACD: fast EMA 12, slow EMA 26, SMA 9
- Bollinger Bands 20


