


4-hour timeframe
Amplitude of the last 5 days (high-low): 41p - 28p - 49p - 101p - 70p.
Average volatility over the past 5 days: 58p (average).
It has long been known that Germany is the locomotive of the entire European Union. It is the Germans who are leaders in GDP among the 27 countries participating in the eurozone. If the economic performance of Germany begins to slow down at first, and then decline, this is another reason for discussing the recession in the European Union. The GDP for the second quarter of 2019 in Germany was published today. The indicator grew by 0.4% compared to the previous year, which is not much, but Gross Domestic Product decreased by 0.1% compared to the first quarter of 2019. This is bad news for the euro and the eurozone. Not critical, but bad. Traders almost did not react to this news, although was still an increase in the US currency during the day. At the same time, volatility is very low, which indicates a low interest of traders in German GDP. Thus, this indicator is more interesting to us, as a harbinger of pan-European GDP, which, in our opinion, could also decline in the second quarter of 2019. Naturally, no one is going to buy the euro on such news, and the common currency continues to fall again, although Friday's trading gave hope for an upward trend. But, as we have already said, Friday's growth cannot be called justified, since Powell's speech was absolutely neutral, and by no means "dovish". We believe that traders realized this over the weekend and began to recoup their mistake on Monday. Thus, we are waiting for the continuation of the downward trend with the renewal of two-year lows.
Even hypothetically now it is difficult to imagine what should happen to the global "dollar trend" to end. On the one hand, as we wrote earlier, over the past 8 months the euro has fallen in price by only 5 cents, and on the other hand, a steady downward trend is still observed. In the current situation, the fate of the euro is in the hands of the US. It is from the United States that negative information should be expected in order to count on the strengthening of the euro. The US dollar should stop being used as a reserve currency for any occasion, even when it comes to a trade war between China and the United States. It is the trade war with Beijing that could be a good reason to stop buying the dollar. At the moment, we can safely say that duties on Chinese and American goods are very high, they have never been higher. Since the parties are far from a trade agreement, new escalations in the trade conflict can be expected. That is, potentially the parties may begin to suffer even greater losses, GDP will slow down, and macroeconomic indicators will decline. This can lead to the US dollar's loss of its highest attractiveness in the eyes of forex traders.
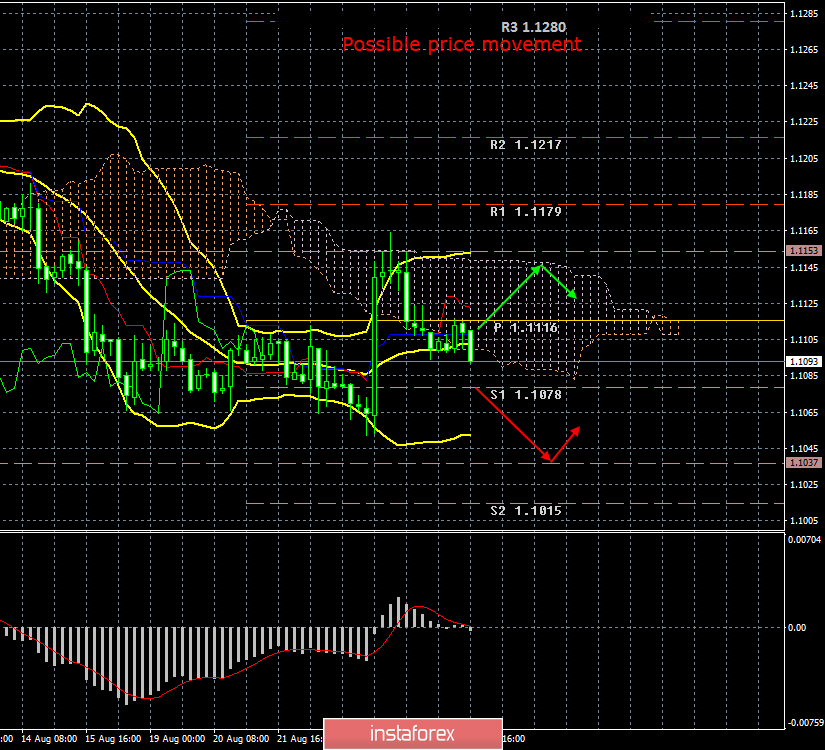
From a technical point of view, the euro/dollar has consolidated below the Kijun-sen critical line, which signals a downward trend in the current trend. In the near future, the formation of the "dead cross" and the influx of bears with new sales of the euro currency is expected.
Trading recommendations:
EUR/USD continues to correct against a weak upward trend. At the moment, it is already possible to consider short positions with the first goal support level of 1.1078. The second goal is the support level based on the current volatility - 1.1037. Bulls once again showed their weakness, having failed to even overcome the Senkou Span B line.
In addition to the technical picture, fundamental data and the time of their release should also be taken into account.
Explanation of the illustration:
Ichimoku indicator:
Tenkan-sen is the red line.
Kijun-sen is the blue line.
Senkou Span A - light brown dotted line.
Senkou Span B - light purple dashed line.
Chikou Span - green line.
Bollinger Bands Indicator:
3 yellow lines.
MACD indicator:
Red line and bar graph with white bars in the indicator window.


