


In August, the price started to move upward and even tested the resistance line of 1.1249 (red bold line), but there weren't enough bulls for more. Fundamental analysis played a significant role in this. After touching the resistance line (red bold line), the price rallied down. The market moves downward and broke to a strong level of 1.1098 (blue bold line) and closed below.
Technical analysis
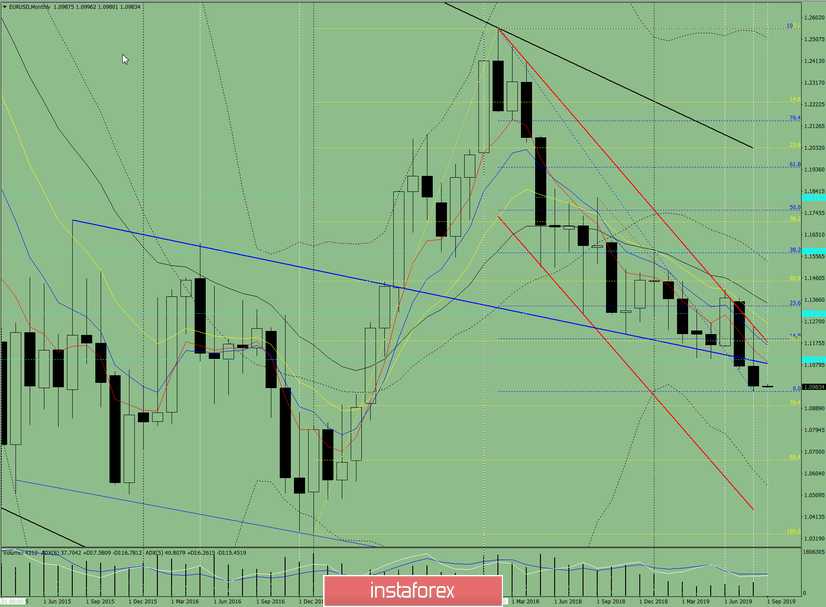
September trading can begin with an upward movement with the first goal of 1.1192 with a pullback level of 14.6% (blue dashed line).
Fig. 1 (monthly chart).
Indicator Analysis:
- indicator analysis - up;
- Fibonacci levels - up;
- volumes - up;
- candlestick analysis - down;
- trend analysis - down;
- Bollinger Lines - down;
The conclusion of a comprehensive analysis - most likely working on the top.
According to the monthly chart, the total result of calculating the EUR/USD candle: the price will most likely have an upward trend with the absence of the first lower shadow (the first week of the month - the upper) and the absence of the second upper shadow (the last week is white).


