


EUR/USD
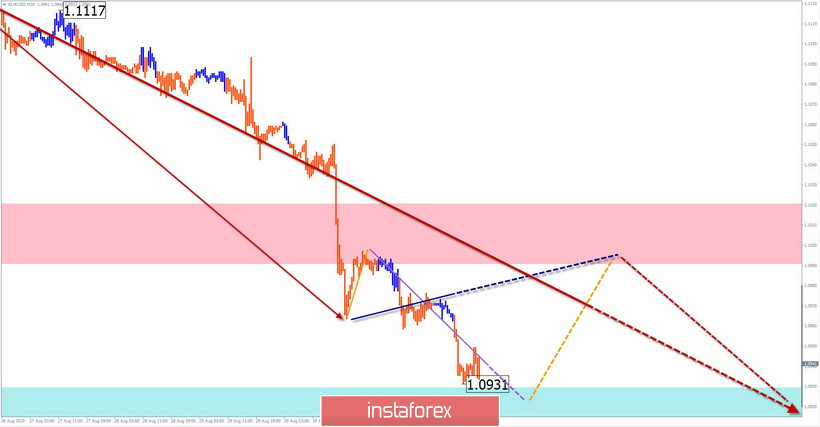
On the euro chart, the bullish wave of August 1 remains the main driving force in the short term. The middle part of the wave (B) showed the maximum degree of elongation. Its structure looks complete. The price achieved a strong support zone.
Forecast:
In the last 2 days, a potential reversal model began to form on the small TF of the price chart. Today, it is expected to complete its middle part and the beginning of the price rise. The expected daily range is indicated by the calculated zones.
Recommendations:
Trading today is possible only within trading sessions. Sales to end the current pullback is not very promising. When purchasing, you should be prepared for a sharp change in course. The deal loses relevance at the first signs of a reversal.
Resistance zone:
- 1.0990/1.1020
Support zone:
- 1.0930/1.0900
GBP/JPY
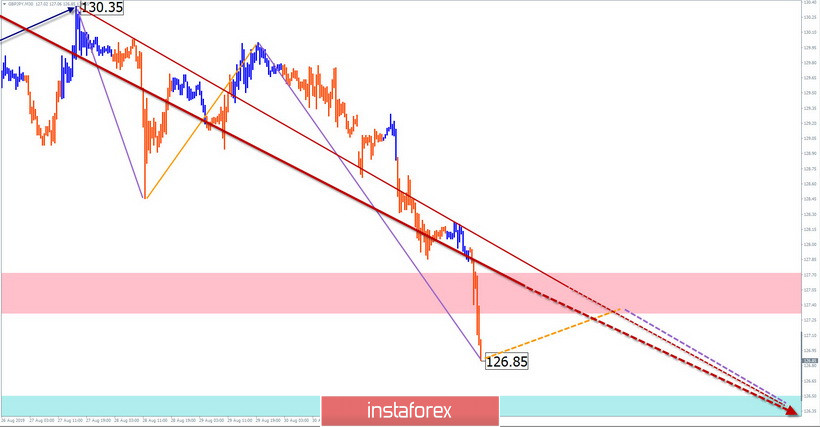
Since March, the direction of the main trend of the cross looks at the "South" of the chart. On August 13, its last section started, in which the final part (C) is formed at the time of analysis.
Forecast:
The movement of the pair has a distinct impulse character. At the next session, we cannot exclude the possibility of a short-term price rise to the resistance zone, but the main vector of movement remains bearish. The designated support zone shows the expected daily course of the pair.
Recommendations:
There are no conditions for cross-pair purchases today. At the end of any price rollbacks, it is recommended to look for entry points in short positions.
Resistance zone:
- 127.30/127.60
Support zone:
- 126.50/126.20
Explanations to figures: Waves in the simplified wave analysis (UVA) consist of 3 parts (A-B-C). Analyzes the last unfinished wave. Zones show the areas with the highest probability of reversal. Arrows indicate the wave count used by the author to the method, a solid background structure for determining the expected movement.
Attention: The wave algorithm does not take into account the length of time the instrument moves.


