


4-hour timeframe
Technical data:
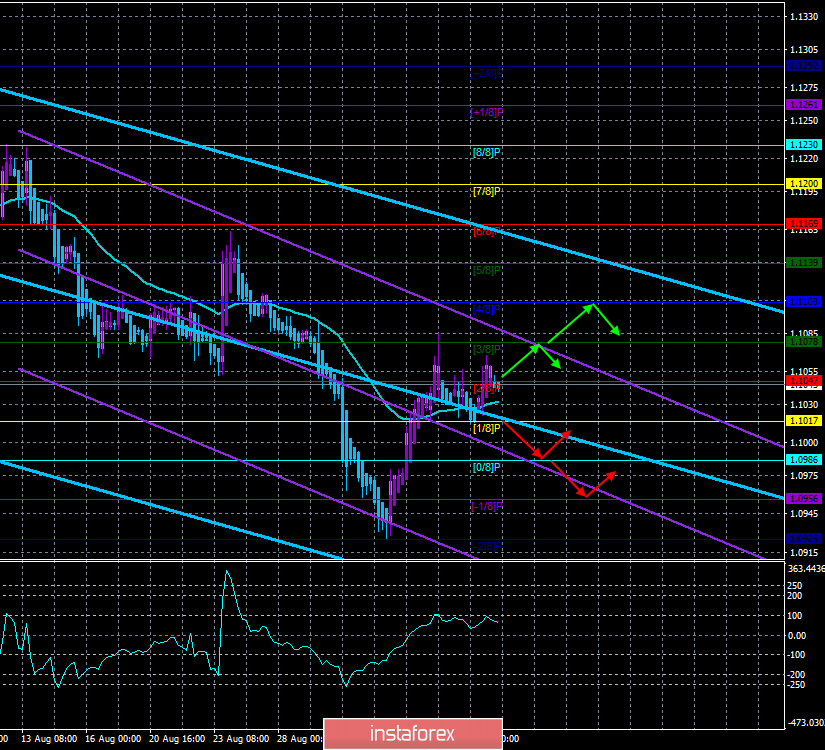
The upper channel of linear regression: direction – down.
The lower channel of linear regression: direction – down.
The moving average (20; smoothed) – sideways.
CCI: 60.5300
The EUR/USD currency pair stayed above the moving average line on the first trading day of the week. More precisely, the consolidation below the moving average occurred, but the nearby Murray level of "1/8" did not allow the euro/dollar pair to continue falling, after which the quotes returned above the moving average line. Despite the fact that the trend remains unambiguously downward, which is perfectly visible on the chart on both channels of linear regression, the bulls won a small victory yesterday. In anticipation of the ECB meeting, which with the highest probability will be announced that will stimulate the economy, that is, lowering rates, and resuming the QE program, as a maximum, not dropping the euro. The fundamental background for the euro in global terms remains disappointing due to weak macroeconomic statistics from the eurozone and stronger from the States, as well as due to a softer monetary policy in the EU, which will also be further relaxed at the next meetings of the regulator. In the short term, there is no fundamental background for the pair. And it will be absent until Thursday when the results of the ECB meeting will be announced. Thus, on Thursday, the euro is almost guaranteed to fall under market pressure, unless the ECB abruptly changes its mind about lowering rates, but on the basis of which should he make such an absurd decision?
On the other hand, experts of Goldman Sachs Group Inc believe that the time to "short" the euro has passed. Experts note that even if the ECB takes significant incentive measures, including a 0.2% rate cut and a monthly bond repurchase of € 30 billion, this does not necessarily mean that the euro will resume falling against the dollar. Goldman Sachs experts point out the reduction of the risk of a "hard Brexit" in the UK, the removal of tension in Italy, where a new government has been formed, and the stimulation of the Chinese economy as arguments.
At the last meeting, the People's Bank of China decided to reduce the required reserves ratio for financial institutions by 0.5%. According to the Chinese regulator, this will free up about 127 billion dollars of cash, which will serve as a support to the economy against the background of the aggravation of the trade war with the United States. The yuan's position against the US dollar may weaken even further on Trump's "joy".
The technical picture is now simple: despite the fact that there is an upward trend in the euro/dollar pair, growth is now unlikely due to the lack of any macroeconomic reports and high expectations for easing the already ultra-soft monetary policy of the ECB.
Nearest support levels:
S1 – 1.1017
S2 – 1.0986
S3 – 1.0956
Nearest resistance levels:
R1 – 1.1047
R2 – 1.1078
R3 – 1.1108
Trading recommendations:
The euro/dollar pair is trading slightly above the moving average line, maintaining a weak upward trend. Thus, it is now possible to buy the pair with targets of 1.1078 and 1.1108, but there are no fundamental reasons for this, but from a technical point of view, a round of downward correction may now begin and one more attempt will be made to gain a foothold back below the moving, which will allow the bears become active in the forex market.
In addition to the technical picture, fundamental data and the time of their release should also be taken into account.
Explanation of illustrations:
The upper linear regression channel – blue line unidirectional movement.
The lower linear regression channel – purple line unidirectional movement.
CCI – the blue line in the indicator window.
The moving average (20; smoothed) – the blue line on the price chart.
Support and resistance – red horizontal lines.
Heiken Ashi is an indicator that colors bars in blue or purple.


