


Trend analysis.
This week, the price will move up with the first target of 1.2668 – resistance line (blue bold line). In the case of achievement – rolling work down.
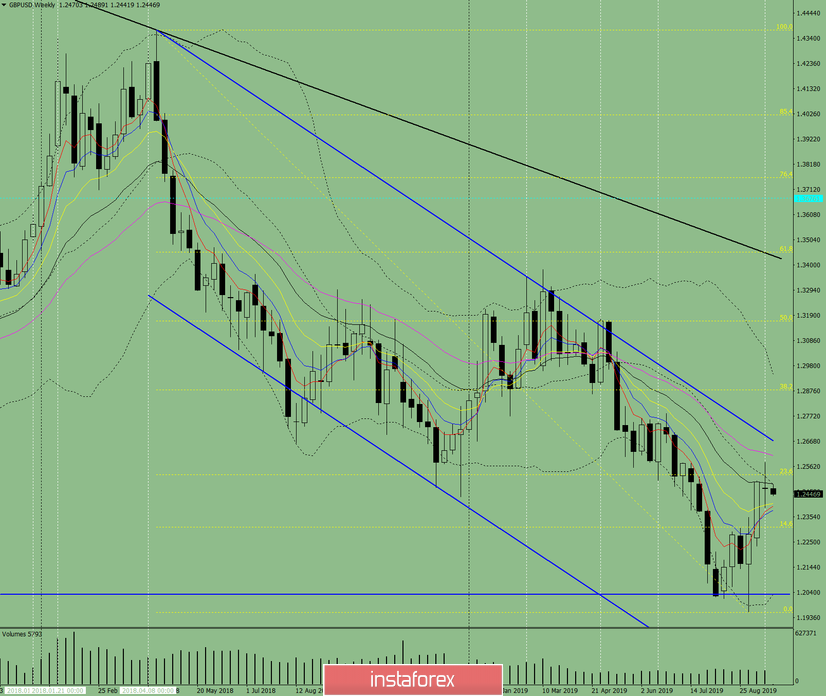
Fig. 1 (weekly chart).
Complex analysis:
- Indicator analysis – up;
- Fibonacci levels – up;
- Volumes – up;
- Candle analysis – up;
- Trend analysis – up;
- Bollinger bands – up;
- Monthly chart – up.
The conclusion of the complex analysis is an upward movement.
The overall result of calculating the candle of the GBP/USD currency pair according to the weekly chart: the price of the week is likely to have an upward trend with the presence of the first lower shadow of the weekly white candlestick (Monday – down) and the absence of the second upper shadow (Friday – up).


