


4-hour timeframe
Amplitude of the last 5 days (high-low): 51p - 72p - 60p - 40p - 84p.
Average volatility over the past 5 days: 61p (average).
The EUR/USD currency pair continues not too hastily, but surely to slide down. Despite the fact that in recent days there was not too much important information from the European Union and the United States, traders continue to sell the currency of the European Union, buying in exchange for US dollars. Today, the pair managed to break through the low of the "double bottom" pattern, which gave hope to traders for the formation of an upward trend. However, the general fundamental background, which we have already written about many times, does not provide the bulls a reason to "engage in battle." Now we have a triple bottom pattern, which has every chance to cancel today or tomorrow, and the currency pair will continue to fall in this case. The technical picture fully supports this particular scenario, since all indicators are directed downward.
Today, the United States published annual GDP data. According to the Bureau of Economic Analysis, an increase of 2.0% in the second quarter was recorded, which is fully consistent with the forecast values. It completely coincides with the forecast that gives reason to assume that the reasons for the euro's new fall are not directly related to recent macroeconomic reports. The index of personal consumption expenditures in the US for the second quarter was also published today, which exceeded forecast values and amounted to +1.9%. However, the euro updated its lows at the European trading session, and not at the US session, when the data were published. Thus, the conclusions remain the same: the euro/dollar continued to get cheaper, despite the possible impeachment of Donald Trump, despite the trade wars of the US president, despite the easing of the monetary policy of the Federal Reserve. It will continue to become cheaper until serious changes in the positive direction begin to be observed in the economy of the European Union. But each week we have an old picture: macroeconomic indicators of the European Union are falling, business activity in the manufacturing sector has been in the "recession zone" for several months, and Mario Draghi himself said that this recession could negatively affect other economic indicators. "May reflect" in our case means "must reflect".
In addition to all the problems of an economic nature in the eurozone, administrative problems also begin. Today, September 26, it became known that a member of the ECB Board of Governors, Sabina Luatenshlager, has resigned. Lautenschlager voluntarily leaves her post without providing reasons. However, it is known that Lautenschlager is an opponent of the policy of ultra-low rates, opposed a new easing of monetary policy and the resumption of the asset purchase program. Here is such a departure from the post of one of the members of the board of governors - this is another bad news for the euro. Everyone immediately remembers what the picture was in the British Parliament about a year ago, when ministers and other high-ranking officials who disagreed with Theresa May's policy left their posts one by one. In principle, the same thing goes on under Boris Johnson. In simple words, this means "escaping from a sinking ship." But no one "escapes from the ship" if it would not sink and there are no problems. One could assume that the problem in Mario Draghi, for example, is an internal conflict or disagreement with his policies. However, Draghi is set to leave his post after a month from now.
Thus, nothing changes for the euro, and we expect the pair to continue to fall. The only hope is at the level of 1.0926, if it stands, then an upward correction is possible. However, in the current conditions, it is a correction. Looking at the older timeframe, a downtrend is clearly visible, which suggests a further fall in the euro / dollar pair.
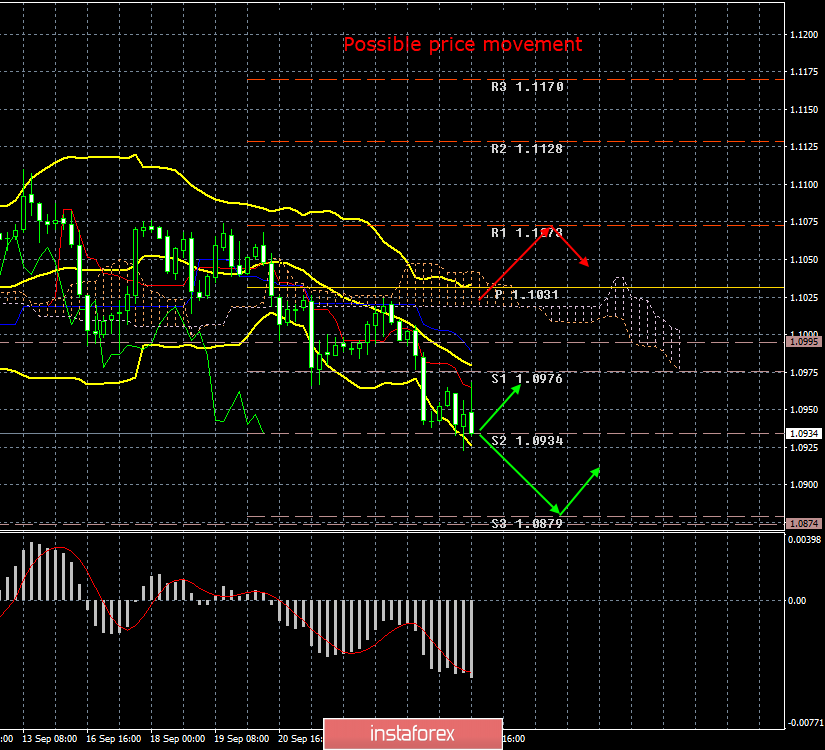
Trading recommendations:
The EUR/USD pair resumed the downward movement. A price rebound from the second support level of 1.0934 may trigger a round of corrective movement, but this correction has not begun in the last 11 hours. Therefore, it is recommended to stay in short positions while aiming for 1.0879. In order for purchase orders to become relevant, it is recommended to wait until the Ichimoku cloud is consolidated above.
In addition to the technical picture, fundamental data and the time of their release should also be taken into account.
Explanation of the illustration:
Ichimoku indicator:
Tenkan-sen is the red line.
Kijun-sen is the blue line.
Senkou Span A - light brown dotted line.
Senkou Span B - light purple dashed line.
Chikou Span - green line.
Bollinger Bands Indicator:
3 yellow lines.
MACD indicator:
Red line and bar graph with white bars in the indicator window.


