


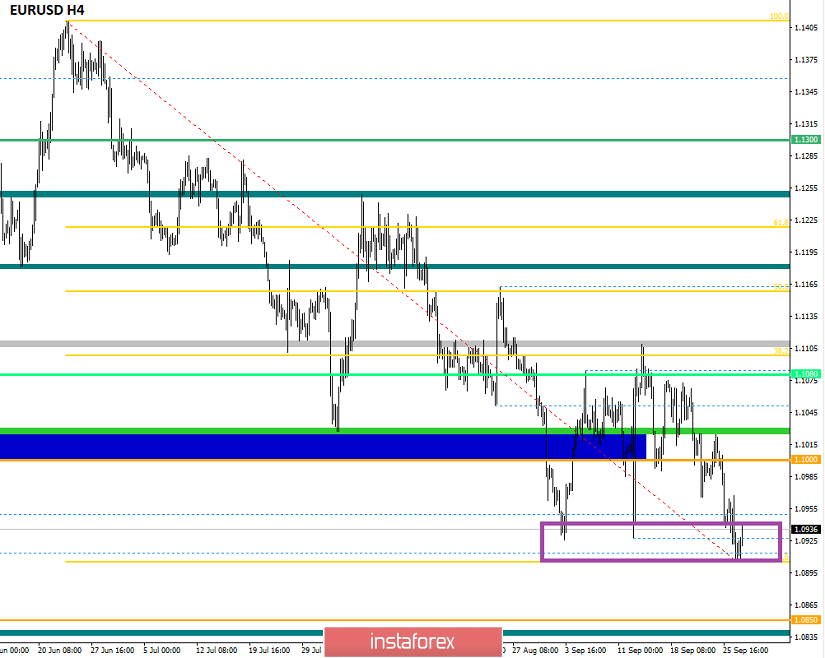
The euro/dollar currency pair for the last trading day showed volatility close to the daily average of 58 points, as a result of which the quote overcame the ill-fated fulcrum, but whether it can be considered a breakdown, we will analyze in the article. From technical analysis, we see that the quote for the first time since the beginning of autumn fell below 1.0926. Let's start from the beginning, the point of 1.0926 was the very support where the corrective movement originated, which passed into the stage of a wide horizontal course. The coordinates of 1.0926 became not just a periodic value of the support, but a full-fledged range level, where the amplitude boundary could stretch by 30-40 points. Thus, the desire to shout about the breakdown may be premature, it is worth waiting a little longer at least for the price to fix below the mark of 1.0900.
As discussed in the previous review, the speculators, having a solid profit more from the value of 1.1000, went into the stage of full fixation as soon as the price began to approach the fulcrum of 1.0926. Insurance always plays an important role, the probability of another rebound from the fulcrum, referring to the regularity of the past, was high, and what's the point of taking risks, if in any case there is always the opportunity to enter again. Naturally, no one canceled further short positions in terms of consideration, but the transition was planned below 1.0900, which did not happen.
Considering the trading chart in general terms (daily period), there is a direct arrangement of Feng Shui. The global downward trend smoothly leaves the zone of sleep, where there is an attempt to break the fulcrum of the corrective course. In the case of confirmation of the breakdown and the preservation of the inertial course, the downward move can return us to the area of the values of the beginning of 2017, which cannot but rejoice, but, again, do not make hasty conclusions, wait for clarification in terms of the mood of the sellers.
The news background of the previous day had data on the GDP of the United States for the second quarter, where the rate of economic growth was confirmed in the form of a slowdown from 2.7% to 2.3%. The reaction of the dollar in terms of weakening was short-term, where the recovery came almost immediately.
In terms of the information background, there was an uproar about the resignation of one of the leaders of the European Central Bank, Sabine Lautenschlager. The ECB statement did not explain the reason for the resignation, but if you refer to anonymous sources, the reason lies in Sabina's tough stance on the resumption of the quantitative easing program (QE). We saw a difference of opinion that led to the resignation. The available news is not so fresh, as information about the resignation appeared on the night of Wednesday to Thursday, that is, at the time of the inactive trading session. We probably got some belated market reaction. In terms of the rest of the information noise, in a sense, everything is calm. The hysteria about the impeachment of US President Donald Trump has faded, which was to be expected, and interesting statements about Brexit did not come out. If we step back a little from the background and go simply to the prospects of the eurozone economy, we see that the level of industry has fallen to its lowest in the last six years due to the influence of uncertain trade tensions and, of course, Brexit as a factor of deterioration. Thus, when we talk about a global downward trend for EURUSD, there are many factors, and a change in the mood at this time is not foreseen.
Today, in terms of the economic calendar, we have only data on orders for durable goods in the United States, where they are projected to decline by 0.1%, which can put local pressure on the US dollar. At a similar time, a member of the Fed Open Market Committee R. Quarles will give a speech, but I doubt that something solid will be said.
The upcoming trading week in terms of the economic calendar pleases with a wide profile of statistical data, where from Monday to Friday there is plenty of news for comfortable trading in terms of volatility. In any case, the flow of spontaneous information background will support the interest of ardent speculators.
The most interesting events displayed below:
On Monday, September 30th
07:00 to 08:55 London time – It is worth monitoring statistics package from Germany
EU 10:00 London time – Unemployment rate (August): Prev 7.5% – Forecast 7.5%
On Tuesday, October 1st
Germany 08:55 London time – German manufacturing PMI (September): Prev 41.4
EU 10:00 London time – Index of business activity in the manufacturing sector (PMI) (September): Prev 45.6 – Forecast 47.0
USA 15:00 London time – ISM index of business activity in the manufacturing sector (September): Prev 49.1 – Forecast 50.4
On Wednesday, October 2nd
USA 13:15 London time – Change in the number of employees in the non-agricultural sector from ADP (September): Prev 195K – Forecast 153K
On Thursday, October 3rd
EU 09:00 London time – Index of business activity in the services sector (September): Prev 52.0 – Forecast 53.4
EU 10: 00 London time – Retail sales (y/y) (August): Prev 2.2% – Forecast 2.0%
USA 15:00 London time – ISM Business Activity Index for Services Sector (September): Prev 56.4 – Forecast 55.8
On Friday, October 4th
USA 13:30 London time – The number of new jobs created outside the agricultural sector (September): Prev 130K – Forecast 162K
Further development
Analyzing the current trade chart, we see that the price continues to swing within the previously completed fulcrum of 1.0926, where an explicit accumulation is formed with an approximate amplitude of 1.0900/1.0940. Speculators, in turn, are waiting for distinct signals of what will happen next – another rebound or a breakdown. In any case, there are good opportunities for earnings, thus monitoring the behavior of quotes and price-fixing points.
It is likely to assume that the amplitude fluctuation of 1.0900/1.0940 will continue for some time, where it is necessary to monitor the price-fixing points relative to the expected boundaries. As you may have guessed, the trading method for the near future: Breakdown/Rebound.
Based on the above information, we will derive trading recommendations:
- Buy positions are considered in terms of rebound and fixing the price above 1.0950, with the prospect of a move towards the level of 1.1000.
- Sell positions are considered in terms of restoring the original trend and fixing the price below 1.0900. In this case, the prospect is in the area of 1.0850-1.0800.
In both cases, it is advised to fix the potential of the inertial motion, so that the probability of success is high.
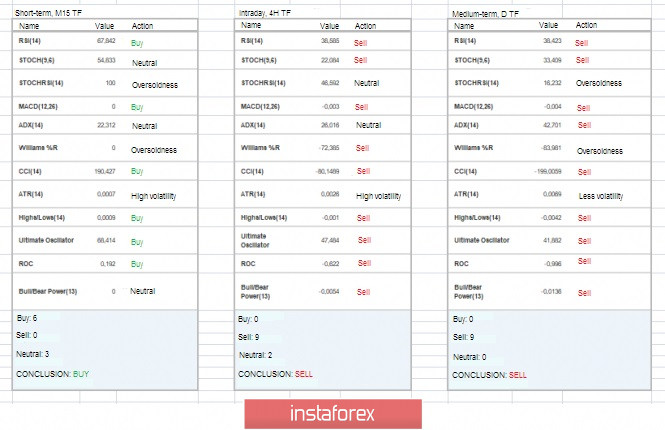
Technical analysis
Analyzing different sectors of timeframes (TF), we see that the indicators in the short-term areas signal an upward interest, which may display a rebound signal, but the quote is still within the expected accumulation. The intraday and medium-term outlook maintain a downward mood against the general background of the market.
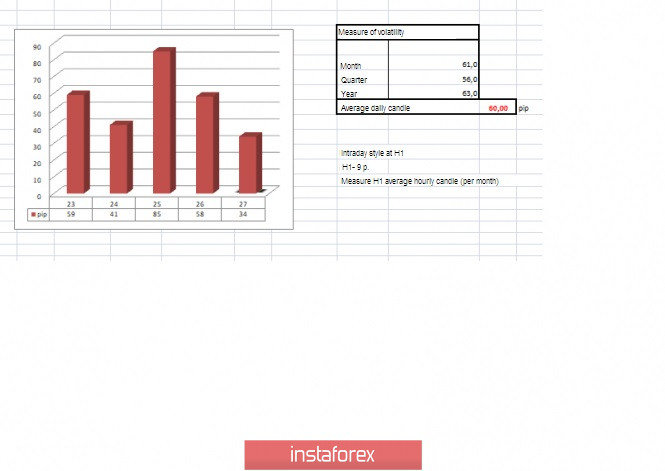
Volatility per week / Measurement of volatility: Month; Quarter; Year
Measurement of volatility reflects the average daily fluctuation, calculated for the Month / Quarter / Year.
(September 27 was built taking into account the time of publication of the article)
The volatility of the current time is 34 points, which is more than 56% of the daily average. It is likely to assume that if one of the scenarios occurs – breakdown or rebound, the volatility will increase, exceeding the daily average. Otherwise, due to stagnation (accumulation), volatility of the day will be limited.
Key level
Resistance zones: 1.0926**; 1.1000***; 1.1100**; 1,1180* ; 1.1300**; 1.1450; 1.1550; 1.1650*; 1.1720**; 1.1850**; 1.2100.
Support zones: 1.0926**; 1.0850**; 1.0500***; 1.0350**; 1.0000***.
* Periodic level
** Range level
*** Psychological level
**** The article is based on the principle of conducting transactions, with daily adjustments.


