


To open long positions on EURUSD, you need:
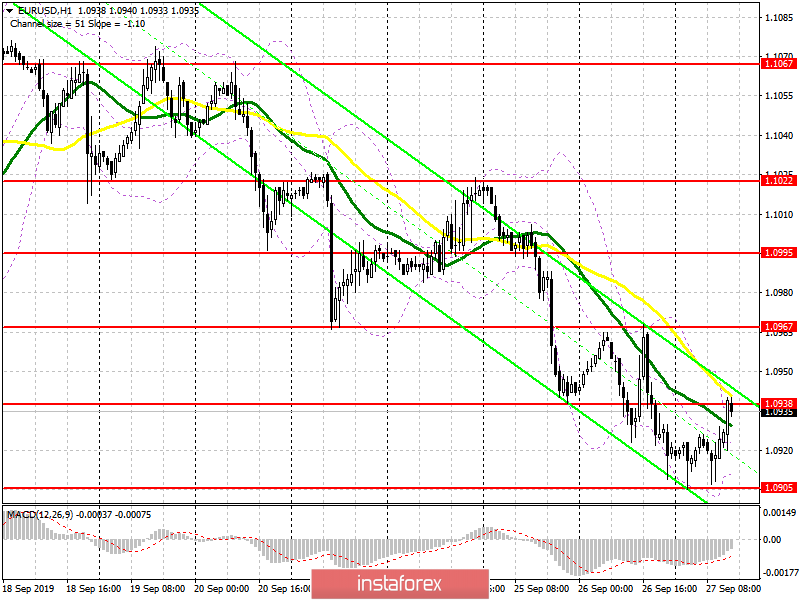
In the first half of the day, data on the consumer confidence index came out, which in September did not deteriorate, but remained unchanged compared to August, which allowed the bulls to keep the morning support level of 1.0900, which I drew attention to in my review. Now, the task of the bulls is to break through and consolidate above the resistance of 1.0938, which can happen after the release of the report on the change in the volume of orders for durable goods in the US. The key target of the bulls at the end of the week will be a maximum of 1.0967, where I recommend fixing the profit. In the scenario of a further decline of EUR/USD in the second half of the day on the trend, the same minimum of 1.0905 will provide support, but it is best to open larger long positions on a rebound from the area of 1.0873.
To open short positions on EURUSD, you need:
Bears have not coped with the morning task, and the whole calculation is now on the resistance. The formation of a false breakdown after the release of the US data will be the first signal to open new short positions to break through and consolidate below the level of 1.0905, which will provide an influx of new sellers of the euro. The main task of the bears will be to test the lows in the area of 1.0873 and 1.0840, where I recommend fixing the profit. In the scenario of buyers returning to the market and rising above the resistance of 1.0938 in the afternoon, it is best to return to short positions by a rebound from the maximum of 1.0967, however even this will not lead to a break in the current downward trend.
Signals:
Moving Averages
Trading is below 30 and 50 moving averages, which indicates the continuation of the bearish trend.
Bollinger Bands
The upper border of the indicator in the area of 1.0938 kept the pair from growing, however, its break will come to a new upward wave. In the case of a decline in the euro in the afternoon, the lower border of the indicator in the area of 1.0910 will provide support.
Description of indicators
- MA (moving average) 50 days – yellow
- MA (moving average) 30 days – green
- MACD: fast EMA 12, slow EMA 26, SMA 9
- Bollinger Bands 20


