


On Tuesday, the pair moving down, reached a pullback level of 61.8% - 1.2197 (blue dotted line) and after that, worked up (130 points). Strong calendar news is expected today at 9.30 London time (pound), 13.15 and 15.30 London time (dollar). In the afternoon, upward movement is possible.
Trend analysis (Fig. 1).
On Wednesday, the price may continue to move down to a pullback level of 14.6% - 1.2261 (red dotted line) again. From this level, it is possible to move up to the pullback level 38.2% - 1.2350 (red dashed line).
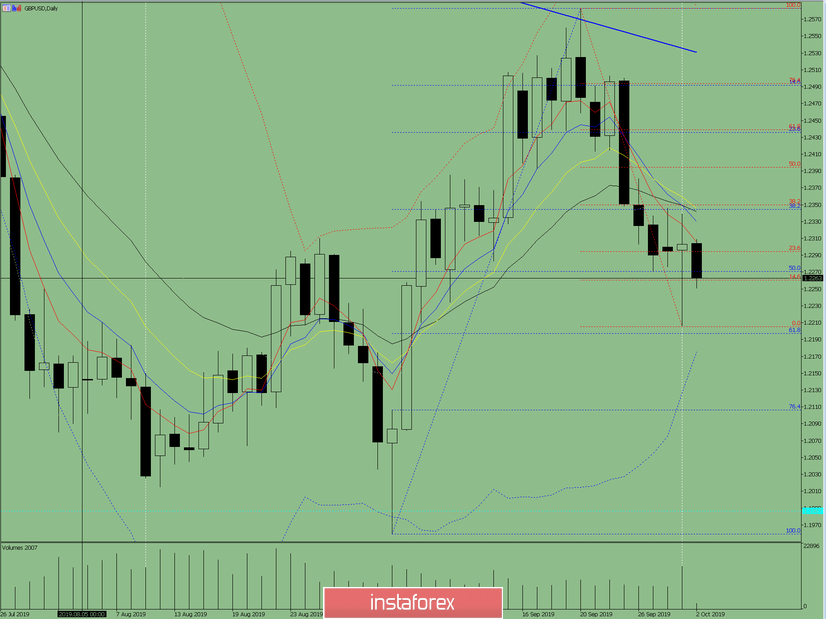
Fig. 1 (daily chart).
Comprehensive analysis:
- indicator analysis - up;
- Fibonacci levels - up;
- volumes - down;
- candlestick analysis - up;
- trend analysis - down;
- Bollinger Lines - down;
- weekly schedule - up.
General conclusion:
On Wednesday afternoon, the price may continue moving upwards.
From the pullback level of 14.6% - 1.2261 (red dashed line), upward movement with the target of 1.2350 - a pullback level of 38.2% (red dashed line) is possible.
An unlikely scenario is a downward movement to the lower fractal - 1.2205 (red dashed line). In case of breaking through this level, the movement down to the lower border of the Bollinger line indicator - 1.2178 (blue dotted line) may continue.


