


Trend analysis (Fig. 1).
On Tuesday, the price may begin to move down with the first target at 1.2764 - a pullback level of 23.6% (blue dashed line). In case of breaking through this level, the continuation of the downward movement to the 21st average EMA is 1.2701 (black thin line).
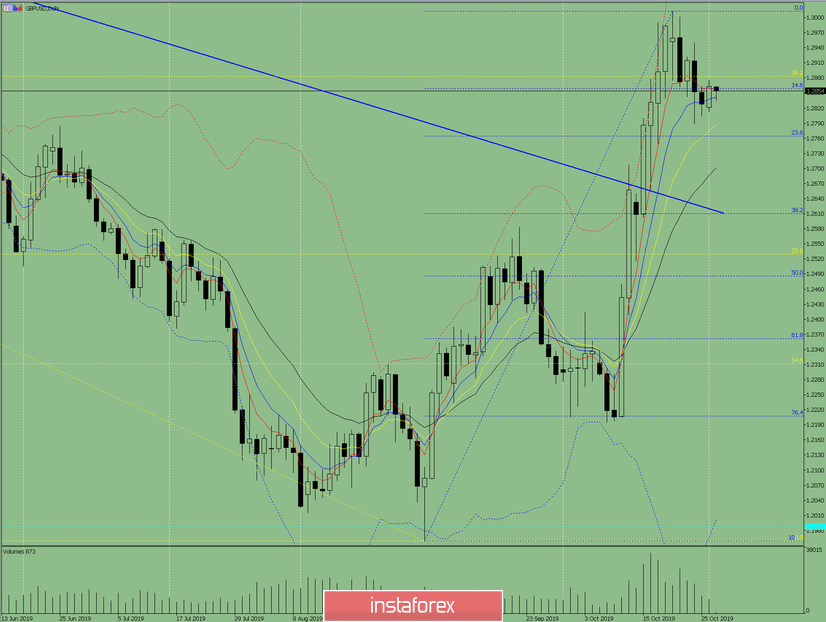
Fig. 1 (daily chart).
Comprehensive analysis:
- Indicator analysis - down;
- Fibonacci levels - down;
- Volumes - down;
- Candlestick analysis - down;
- Trend analysis - up;
- Bollinger Lines - down;
- Weekly schedule - down.
General conclusion:
On Tuesday, the price may roll back down.
The first lower target 1.2764 is a retracement level of 23.6% (blue dashed line).
The second lower target is 1.2701 - 21 average EMA (black thin line).
An unlikely scenario is an upward trend with the target at 1.2950 (upper fractal).


