


EUR/USD
Analysis:
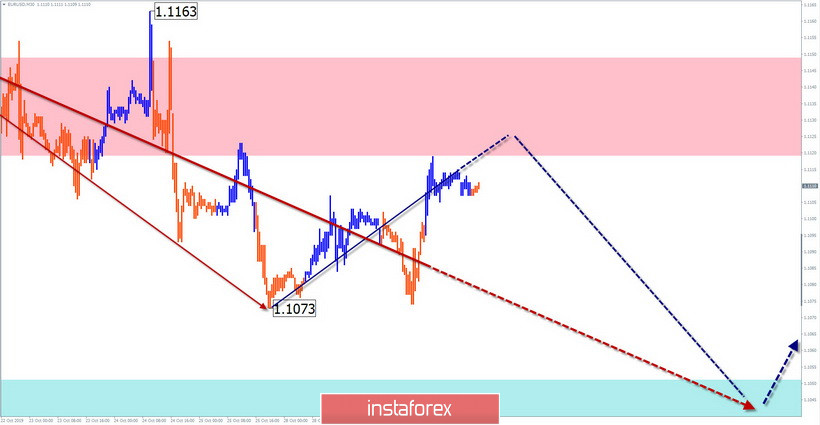
The unfinished wave model of the euro chart started in early August. The wave has the form of a stretched plane. From October 21, a corrective zigzag has been developing in the last part.
Forecast:
A flat day is expected. During the next sessions, the completion of the intermediate pullback up, the formation of a reversal and the price move of the pair down is likely. The target area for completing the entire current decline is the estimated support.
Potential reversal zones
Resistance:
- 1.1120/1.1150
Support:
- 1.1050/1.1020
Recommendations:
Until the downside pullback is completed, it is wiser to refrain from entering the pair's market. Trading today is shown only in intraday style. Focus on sell signals.
AUD/USD
Analysis:
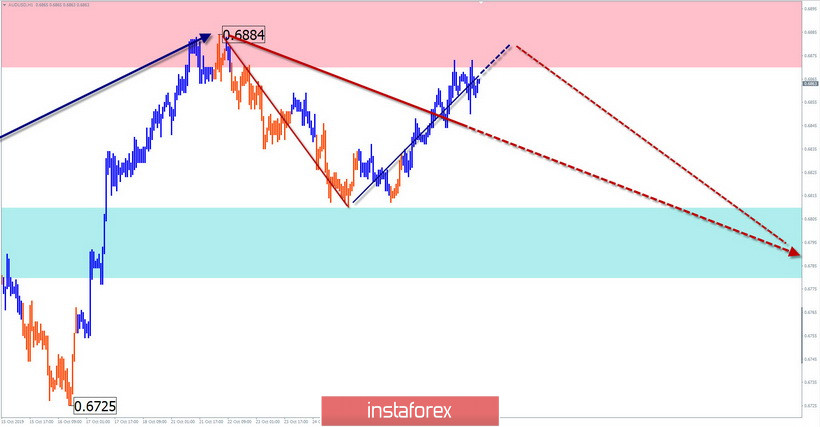
The current wave pattern "Aussie" shows the formation of a bearish zigzag, with a starting point on September 12. In the upward correction section, the structure shows completeness. The estimated target zone has been reached. Previously, we can conclude that the first part of the wave (A-B) is completed.
Forecast:
Beginning October 21, the downward reversal structure has a high chance of completing today. In the next session, pressure on the resistance zone is possible. By the end of the day, the pair is expected to reverse and decline.
Potential reversal zones
Resistance:
- 0.6870/0.6900
Support:
- 0.6810/0.6780
Recommendations:
It is better to refrain from trading until clear signals of completion of the current rise appear. It is recommended to monitor the appearance of reversal signs in the search for optimal selling points of the instrument.
Explanations: In the simplified wave analysis (UVA), the waves consist of 3 parts (A-B-C). The last unfinished wave is analyzed. The solid background of the arrows shows the formed structure, dotted – the expected movement.
Attention: The wave algorithm does not take into account the length of time the tool moves!


