


At the beginning of last week, the pair moving up, tested the resistance line - 1.1093 (red bold line) and after that, made a downward movement, breaking through the pullback level of 50% - 1.1028 (red dashed line), but reach the lower fractal 1.0987 (blue dashed line). Next week, the price will try to make a movement upwards.
Trend analysis.
This week, the price will move up with the first target of 1.1061 - a pullback level of 38.2% (blue dashed line). When breaking through the top of this level, the next upper target will be the resistance line 1.1079 (red bold line).
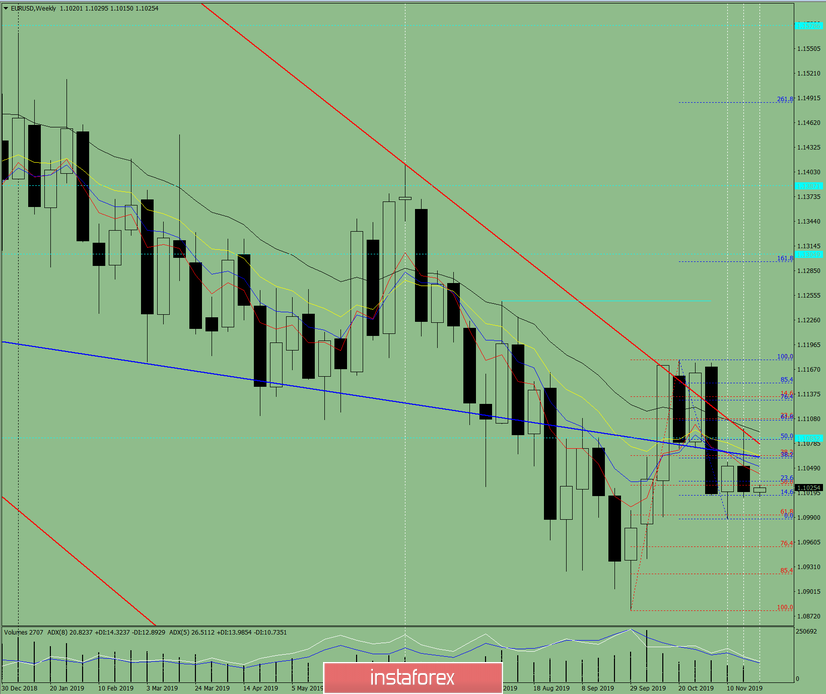
Fig. 1 (weekly schedule).
Comprehensive analysis:
- indicator analysis - up;
- Fibonacci levels - up;
- volumes - up;
- candlestick analysis - neutral;
- trend analysis - neutral;
- Bollinger Lines - down;
- monthly chart - down.
The conclusion of a comprehensive analysis is an upward movement.
The overall result of calculating the candle of the EUR/USD currency pair according to the weekly chart: the price of the week is likely to have an upward trend, with the presence of the first lower shadow of the weekly white candlestick (Monday - down) and the presence of the second upper shadow (Friday - down).
The first target when moving up is 1.106, which is a pullback level of 38.2% (blue dashed line). When breaking up this level, the next upper target will be the resistance line 1.1079 (red bold line).
An unlikely scenario: the first lower target of 1.0987 is the lower fractal (blue dashed line). If successful, continue to the next lower target, the pullback level of 76.4% - 10955 (red dashed line).


