


Trend analysis.
This week, the price will move up with the first target 1.2903 - the resistance line (red bold line). If reached, continue to the next upper target 1.3010 - the upper fractal (red dashed line).
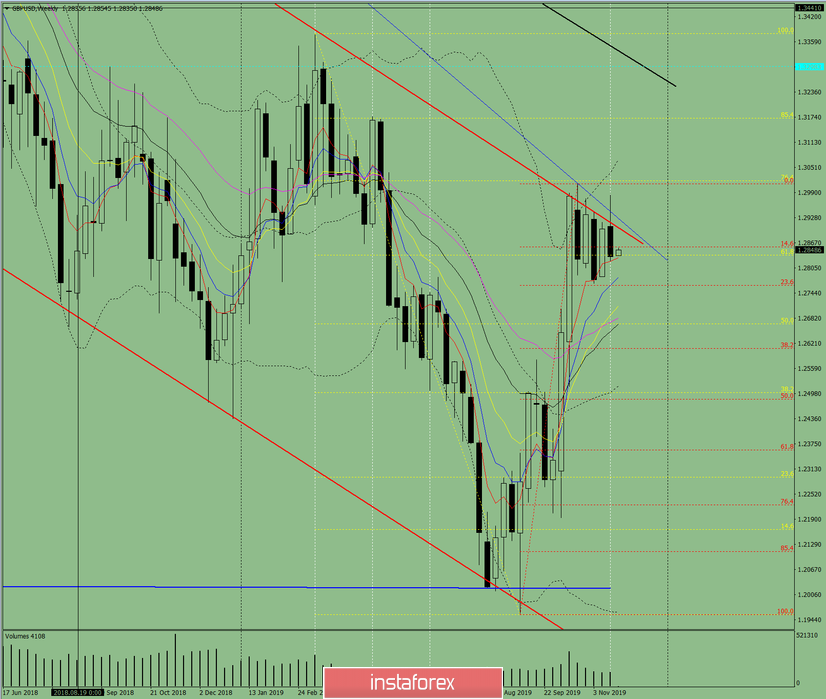
Fig. 1 (weekly schedule).
Comprehensive analysis:
- indicator analysis - up;
- Fibonacci levels - up;
- volumes - up;
- candlestick analysis - neutral;
- trend analysis - down;
- Bollinger Lines - down;
- monthly chart - up.
The conclusion of a comprehensive analysis is an upward movement.
The overall result of calculating the candle of the GBP/USD currency pair according to the weekly chart: the price of the week is likely to have an upward trend with the absence of the first lower shadow of the weekly white candlestick (Monday - up) and the absence of the second upper shadow (Friday - up).
The first upper target 1.2903 is the resistance line (red bold line). If reached, you can continue to the next upper target 1.3010 - the upper fractal (red dashed line).
An unlikely scenario - from the level of 1.2903, work down with the target of 1.2762 - a pullback level of 23.6% (red dashed line).


