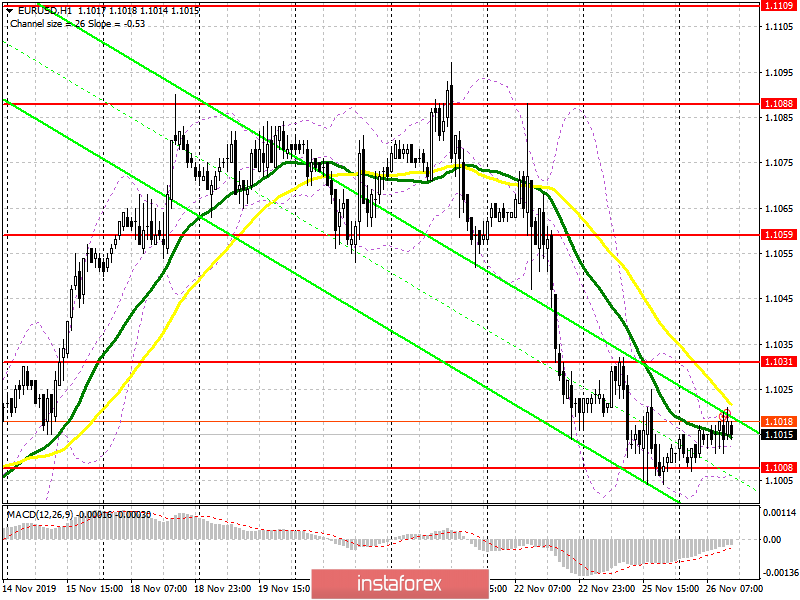
To open long positions on EURUSD you need:
Data on Germany, namely on the consumer climate index, which reached 9.7 points against 9.6 points in October this year, did not make any changes in the market and left it near weekly lows. Buyers are still defending the support level of 1.1008, which I paid attention to back in the morning review. However, it is best to open long positions from it only after the formation of a false breakdown. You can buy immediately on the rebound from the larger support area of 1.0989. The main task of the bulls in the second half of the day will be a return to the resistance of 1.1031, where I recommend taking the profits. However, this can be done under the condition of weak fundamental statistics, the release of which is scheduled for the American economy in the second half of the day. Particular attention will be drawn to the report on the consumer confidence indicator, which is expected to grow to 126.9 points in November this year. Weak data will test the resistance of 1.1031 again, a breakthrough of which will lead to an update of the maximum of 1.1059.
To open short positions on EURUSD you need:
On the contrary, good indicators on the US economy and consumer confidence growth will allow bears to increase their short positions in EUR/USD. The breakout of the support of 1.1008, which buyers are trying to keep now, will lead to another wave of sales of EUR/USD with the update of the lows in the area of 1.0989 and 1.0972, where I recommend taking the profits since the lower border of the current downward channel passes in this range. In the absence of activity at the level of 1.1008, short positions can be returned only after the formation of a false breakdown in the resistance area of 1.1031 or sell the euro immediately on the rebound from the maximum of 1.1059.
Indicator signals:
Moving Averages
Trading is below the 30 and 50 moving averages, which indicates a further probability of a decline in the euro.
Bollinger Bands
Breaking the lower border of the indicator around 1.1008 will lead to a larger sell-off of the euro.

Description of indicators
- Moving average (moving average determines the current trend by smoothing volatility and noise). Period 50. The chart is marked in yellow.
- Moving average (moving average determines the current trend by smoothing volatility and noise). Period 30. The chart is marked in green.
- MACD indicator (Moving Average Convergence / Divergence - convergence/divergence of moving averages). Fast EMA period 12. Slow EMA period 26. SMA period 9
- Bollinger Bands (Bollinger Bands). Period 20.


