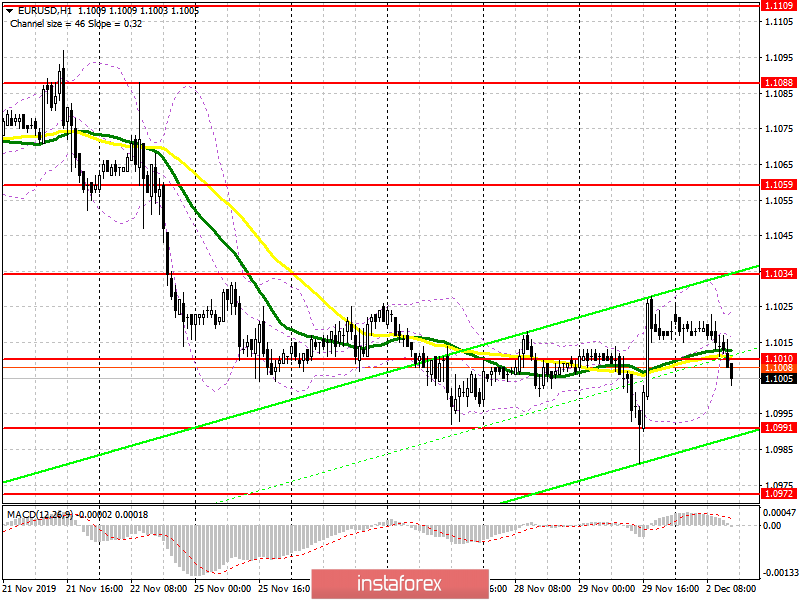
To open long positions on EURUSD you need:
Predictably, the euro fell in the first half of the day after reports that indicated continued weakness in the eurozone manufacturing sector. Although several indicators have grown, activity has continued to decline in almost all countries. Traders also decided not to rush into opening long positions on the euro ahead of a speech by the new president of the European Central Bank, Christine Lagarde. Her statements can support the European currency, and a return back to the level of 1.1010 will be a kind of signal to open long positions to update the resistance of 1.1034, where I recommend taking the profits. We should also not forget about the data on the US manufacturing sector, the release of which is scheduled for the second half of the day. A good report can lead to a decrease in EUR/USD to the support area of 1.0990, from where I recommend opening long positions. Buy immediately on the rebound is best from the low of 1.0970.
To open short positions on EURUSD you need:
Sellers coped with the morning task and returned the pair under the middle of the channel 1.1010. However, this did not lead to the formation of a larger wave of decline. As noted above, the focus will shift to Christine Lagarde's speech as well as the US data. Good indicators will lead to a decrease in EUR/USD in the area of the minimum of 1.0990 and will allow you to count on the update of the support of 1.0970, where I recommend taking the profits. With the growth of the euro in the second half of the day above the level of 1.1010, and this scenario is more likely, it is best to consider short positions after updating the maximum of 1.1034 and sell immediately on the rebound from the resistance of 1.1059.
Indicator signals:
Moving Averages
Trading is conducted in the area of 30 and 50 moving averages, which indicates the lateral nature of the market.
Bollinger Bands
Volatility decreased before important data, which does not give signals to enter the market.

Description of indicators
- Moving average (moving average determines the current trend by smoothing volatility and noise). Period 50. The chart is marked in yellow.
- Moving average (moving average determines the current trend by smoothing volatility and noise). Period 30. The chart is marked in green.
- MACD indicator (Moving Average Convergence / Divergence-convergence/divergence of moving averages) - EMA period 12. Slow EMA Period 26. SMA Period 9
- Bollinger Bands (Bollinger Bands). Period 20


