Hello, dear colleagues!
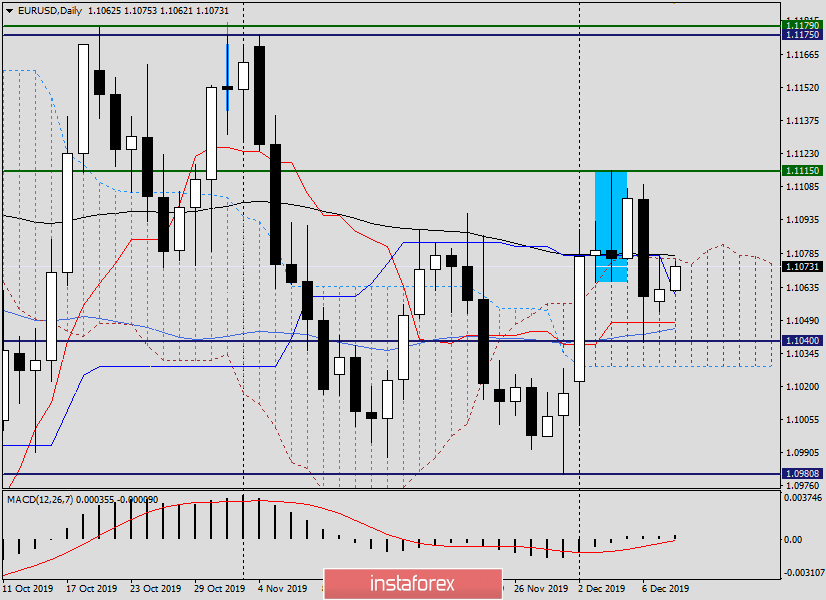
Yesterday's trading session was held in the attempts of the main currency pair of the market to go up from the Ichimoku indicator cloud and at the same time break through the 89-exponential moving average with the Kijun line. Again, this mission was impossible for the euro.
Despite the positive macroeconomic reports from Germany's balance of payments, as well as the indicator of investor confidence from Sentix in the eurozone, the driver to go up from the cloud and the breakdown of 89 EMA was not enough.
Today, Germany and the eurozone will receive data on the index of sentiment in the business environment from the ZEW Institute.
The US will publish reports on the level of labor productivity in the non-agricultural sectors of the economy, as well as the level of labor costs.
As promised in yesterday's euro/dollar survey, today we will look at smaller time intervals to find entry points into the market. However, I will start with the daily chart.
Daily

Again, I have to draw your attention to the importance of the moment. Namely, the intrigue is whether the pair will be able to go up from the Ichimoku cloud, breakthrough 89 EMA and close trading higher. If we consider that the exhibitor's route passes directly below the iconic level of 1.1080, the importance of the moment only increases.
If the euro bulls will be able to bring the quote up and close trading above 1.1080, the next nearest target will be in the price zone of 1.1109-1.1115, where the maximum values of trading on December 6 and 4 are noted, respectively.
In the case of another failure, the pair will fall to the area of 1.1050-1.1040, where Tenkan, 55 MA and lows on December 6.
H4

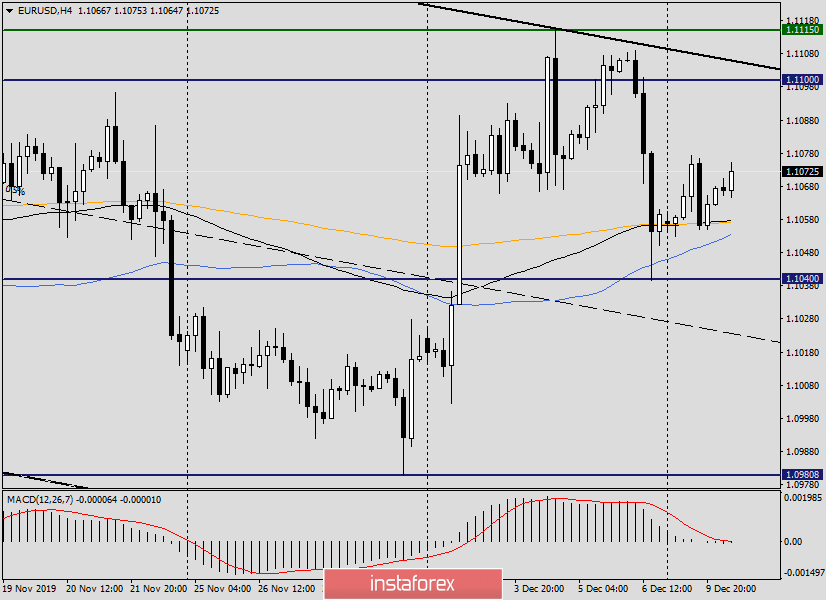
In this timeframe, I built a downward channel with the parameters of 1.1175-1.1115 (resistance line) and 1.0988 (support line). At the time of writing, the euro/dollar is trading at the top of the channel and above the moving averages of 55 MA, 89 EMA and 200 EMA. This factor increases the probability of rising to the resistance line of the channel and testing it for a breakdown.
However, it is worth noting here that the upper border of the channel intersects with a strong technical level of 1.1100. Given that below the ill-fated mark of 1.1080, above the resistance of 1.1115, the road up for the pair will be difficult and thorny. Nevertheless, it is more inclined to consider the bullish scenario, and it is better to try opening long positions after lowering EUR/USD to the price zone of 1.1060-1.1040.
If bearish candlestick signals appear in the resistance area of 1.1080-1.1110, it is worth considering selling with a stop above 1.1115 and targets near 1.1050.
H1

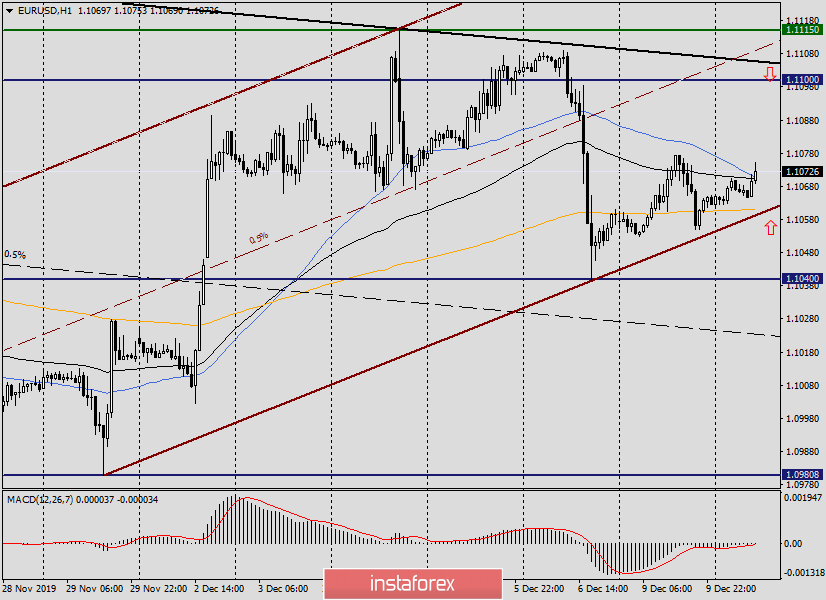
But on the hourly chart, the pair is already trading on the upward channel. At the time of completion of this article, the course is trying to overcome 89 EMA and 55 MA. If it turns out, I expect a continuation of the rise in the area of 1.1080-1.1115.
It is characteristic that in the designated zone, there are levels of 1.1080, 1.1100 and 1.1115. Also here is the upper border (black line) of the 4-hour channel and the middle (brown dotted channel of the hour). In my opinion, there is every technical reason to consider selling after the price rises to 1.1080-1.1110. An additional signal for the opening of sales will be the appearance in the selected zone of candlestick signals for a decrease.
As for purchasing. If the pair breaks up 55 MA and 89 EMA and consolidates higher, then on the rollback to the broken movings you can try to buy, but for now, it is better with small goals. Another option for opening long positions will be a decline in the already designated price zone of 1.1060-1.1040.
I wish you successful and profitable trades!


