Overview:
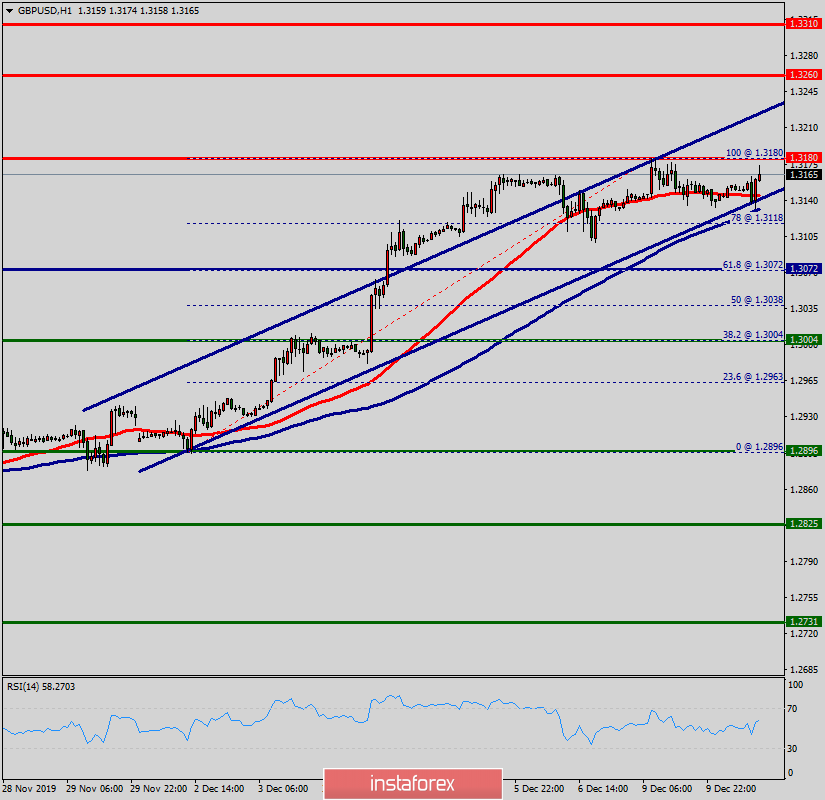
The GBP/USD pair will continue to rise from the level of 1.3072. The support is found at the level of 1.3072, which represents the 61.8% Fibonacci retracement level in the H1 time frame.
The price is likely to form a double bottom. Today, the major support is seen at 1.3072, while immediate resistance is seen at 1.3180. Accordingly, the GBP/USD pair is showing signs of strength following a breakout of a high at 1.3180.
So, buy above the level of 1.3072 with the first target at 1.3182 in order to test the daily resistance 1 and move further to 1.3260.
Also, the level of 1.3310 is a good place to take profit because it will form a new double top.
Amid the previous events, the pair is still in an uptrend; for that we expect the GBP/USD pair to climb from 1.3072 to 1.3310 today.
This would suggest a bullish market because the RSI indicator is still in a positive spot and does not show any trend-reversal signs. The pair is expected to rise higher towards at least 1.3310 so as to test the daily resistance 3 in coming hours.
At the same time, in case a reversal takes place and the GBP/USD pair breaks through the support level of 1.3072, a further decline to 1.3004 can occur, which would indicate a bearish market.


