To open long positions on EURUSD you need:
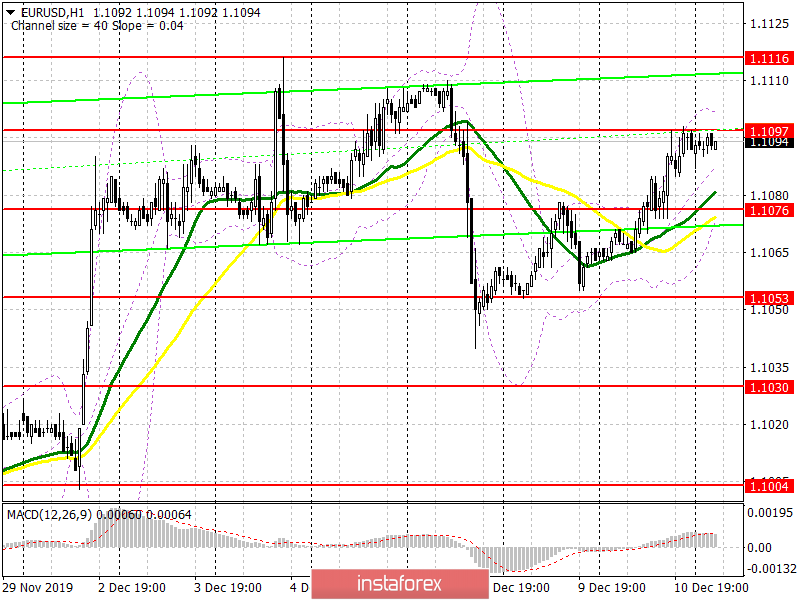
Yesterday, the bulls were able to return the euro to an important resistance level of 1.1097, which I repeatedly paid attention to in my reviews. Today, the focus in the morning will shift to US inflation data, which could shed light on the Federal Reserve's final decision on interest rates, which will be announced this afternoon. To maintain an upward momentum, the bulls need a breakout and consolidation above the resistance of 1.1097, since we can expect a larger upward trend to the area of highs 1.1116 and 1.1135 in this scenario, where I recommend profit taking. In the scenario of EUR/USD decline in the morning, the formation of a false breakout in the support area of 1.1076 will be a signal to open long positions. Otherwise, it is best to buy the euro at a rebound from the lower boundary of the wide side channel in the region of 1.1053.
To open short positions on EURUSD you need:
Bears need to again form a false breakout in the resistance area of 1.1097, which will be the first signal to open short positions in the euro, however, it will be possible to talk about the return of large players to the market only after the release of inflation data in the US. If the result is better than economists' forecasts, sellers will quickly throw the euro into the support area of 1.1076, and consolidating below this range will lead to a larger sale in the area of a low of 1.1053, where I recommend profit taking, as it will be possible to break below this area only after the publication of the Fed's decision on the interest rate, which is expected in the afternoon. If the bears miss the resistance of 1.1097 in the morning, then it will be possible to talk about short positions after updating the high of 1.1116, and it is best to immediately sell for a rebound from the level of 1.1135.
Signals of indicators:
Moving averages
Trading is conducted above 30 and 50 moving average, which keeps the chance to continue the upward trend for the euro.
Bollinger bands
A break of the upper boundary of the indicator in the region of 1.1100 will lead to a new wave of euro growth, while a downward correction will be limited by the support of 1.1070.

Description of indicators
- Moving average (moving average determines the current trend by smoothing out volatility and noise). Period 50. The graph is marked in yellow.
- Moving average (moving average determines the current trend by smoothing out volatility and noise). Period 30. The graph is marked in green.
- MACD indicator (Moving Average Convergence / Divergence - moving average convergence / divergence) Fast EMA period 12. Slow EMA period 26. SMA period 9
- Bollinger Bands (Bollinger Bands). Period 20


