


Greetings, dear traders!
In this article, we will consider the technical aspects that are observed in the pair of North American dollars, but first, it is necessary to highlight the upcoming macroeconomic releases.
Today at 14:30 (London time), Canada will present reports on the prices of new housing, and at 18:30 (London time), the head of the Canadian Central Bank, Stephen Poloz, will make a speech.
The US today will publish data on initial applications for unemployment benefits, as well as the producer price index.
Tomorrow, there will be no statistics from Canada, but the Americans will present data on retail sales and inventories. Not very important events, but it's better not to forget about them. Now to the charts.
Daily
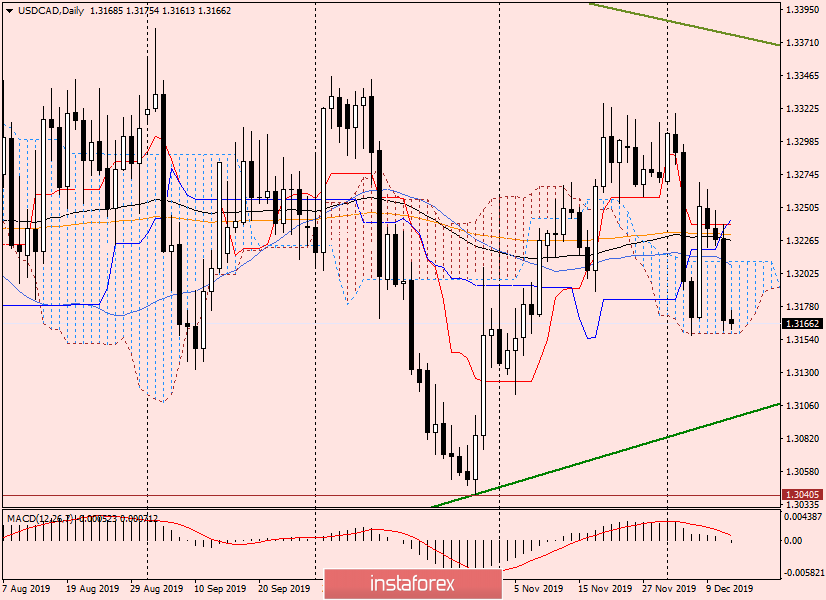
As previously expected, the pair met strong resistance around 1.3226-1.3242, where 89 EMA, 200 EMA, as well as the Kijun and Tenkan lines of the Ichimoku indicator, accumulated. At first, all these obstacles were passed, but it was not possible to gain a foothold higher and taking advantage of the negative reaction of the market to the rhetoric of the Fed, the pair collapsed downwards.
As can be seen in this timeframe, the price has several times approached and even touched the lower border of the Ichimoku cloud, but there has been no exit down. If it does happen (and it is coming) and USD/CAD will consolidate lower, sellers' positions will become stronger and the green support line 1.2061-1.3041 will probably be tested. The true breakdown of this line will further indicate the control of the bears over the market on USD/CAD.
At the moment, the lower border of the cloud continues to support the price, so it is likely that from the current prices, USD/CAD can turn up and roll back to the broken moving averages - Kijun and Tenkan.
However, while the US currency cannot boast of the favor of investors, and if such sentiments persist, the pair will still fall from the cloud.
H4
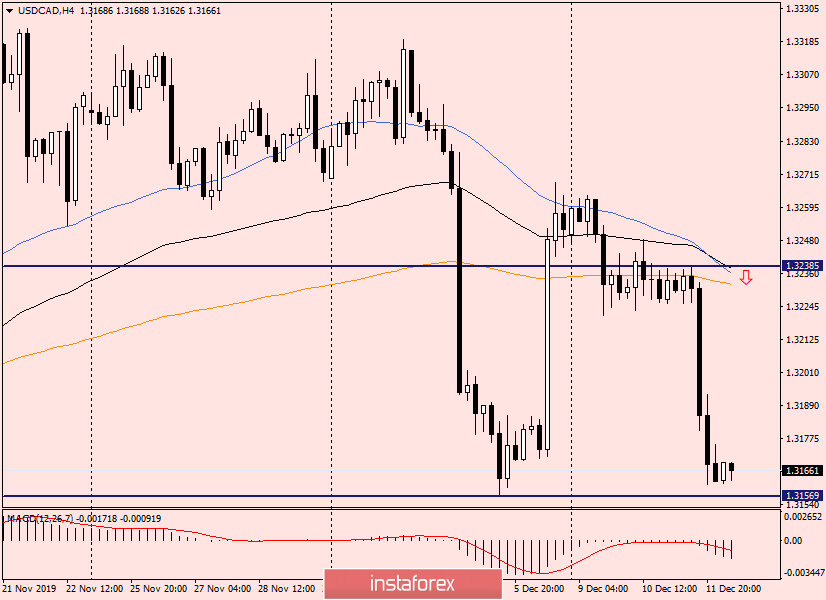
At this period, attention is drawn to the steep price jumps up and down. Volatility, however. Nevertheless, after yesterday's reaction of market participants to the Fed, it is unknown when the "American" will recover and come out from under the pressure of sales.
If we assume that at this stage in time the pair's sales are considered to be the most relevant (and it is), then a strong technical area is immediately evident near 1.3235, where the moving averages are used, which, in the case of a rise in the price, are ready to provide serious resistance. According to the technique, sales from here look quite appropriate, only it is necessary that the pair took off sharply and immediately turned down, leaving a long lower shadow. If the quote lingers near 1.3235 and consolidation begins, a reverse breakout up is not excluded.
Now, the "Canadian" is trading near the support level of 1.3157 and shows intentions to go for correction. If the current 4-hour candlestick is made in the form of a bullish model, you can try neat purchases with a small stop.
H1
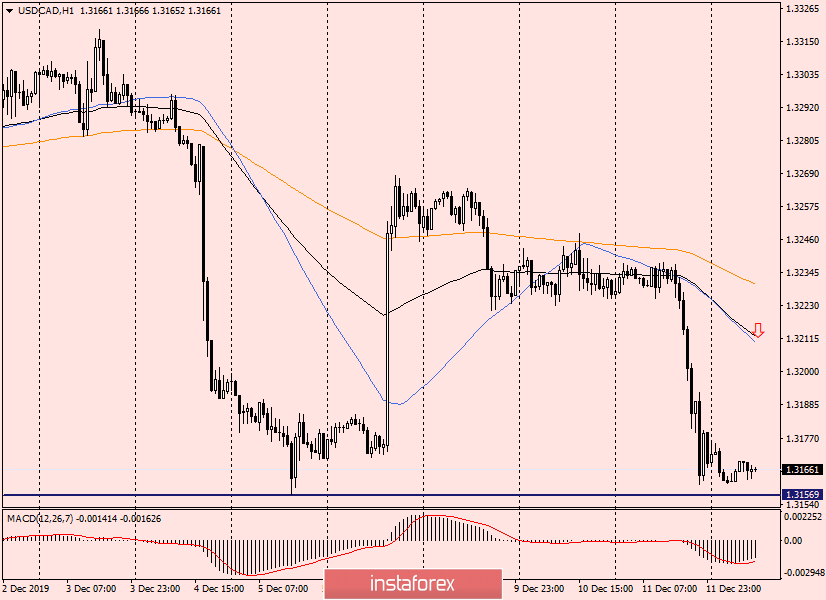
On the hour, the picture is twofold. On the one hand, it is impossible to exclude the formation of a figure for continuing the technical analysis of the "Inverted Flag", on the other hand, attempts to correct the rollback to the area 1.3210-1.3232 are confirmed, where moving averages are turning down after the price. I believe that 50 MA, 89 EMA, and 200 EMA are quite capable of strong resistance and turn the price down.
Thus, the idea of selling USD/CAD is confirmed on the hourly chart. However, purchases based on the rollback remain relevant, but I think they are riskier. The US dollar is now weak.
Good luck!


