


Hello, dear colleagues!
Yesterday's data on the index of business activity in the services and manufacturing sectors of France, Germany, and the eurozone came out mixed, therefore, it is unlikely to have a clear impact on the strengthening of the single European currency against the US dollar. Nevertheless, it happened. The euro/dollar currency pair strengthened at the end of trading on December 16. A little later, we will consider the price charts, but for now, let's talk about the macroeconomic reports scheduled for today.
At 11:00 (London time), we will receive information on the trade balance without seasonal adjustments from the euro area. And that's all from Europe for today. But from the United States at 14:30 (London time), a whole block of data will be released, which will include construction permits and bookmarks of new homes, capacity utilization, reports on industrial production, as well as statistics on the level of vacancies and labor turnover.
Of course, these are not the most significant macroeconomic indicators, but under certain circumstances, they can affect the price dynamics of the main currency pair of the market. And now to the EUR/USD charts.
Daily
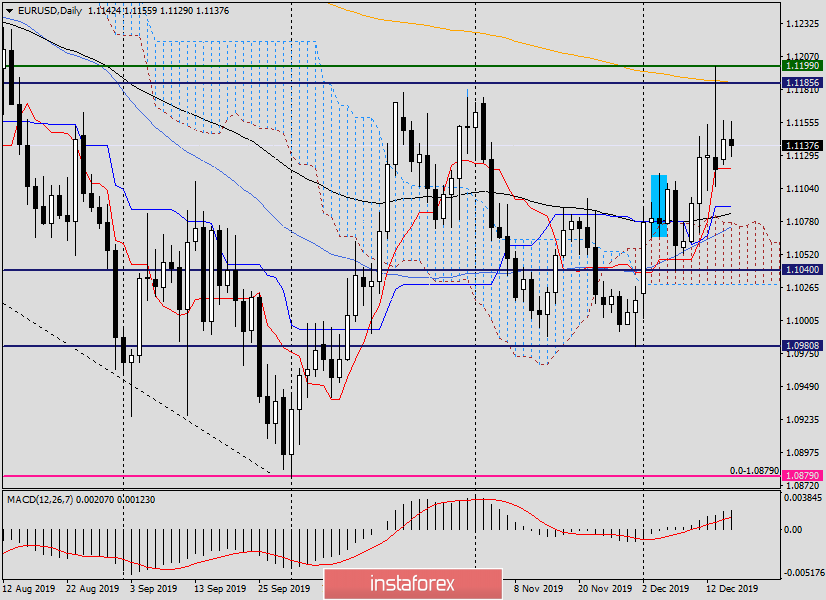
As you can see, the euro bulls are not going to give up and throw a white flag. At least that's what the situation looks like at this point. After the frankly bearish candles for December 13 (and a number something else!), it was quite possible to expect a decline in the rate. I'll explain my point right away. The downward scenario is still relevant and will remain so until there is a bullish absorption of the Friday candle. Only this factor, as well as the breakdown of the 233 exponential moving average and the resistance level of 1.11199, will indicate the bullish mood of investors for the main currency pair and open the way to further goals. In this case, we are waiting for a quote at 1.1225, 1.1250, and 1.1285. Near the last two levels, a reversal to a corrective pullback to the area of 1.1230-1.1190 is not ruled out, after which a renewal of the upward impulse can most likely be expected. However, there is an important point. In my personal opinion, euro bulls need to consolidate trading on the pair above 1.1250. It is enough to look at history to see and understand that this is a very important and strong technical level. If we designate a price area, which both in history and in the current situation has a significant impact on the price, it is certainly 1.1200-1.1250.
In an alternative scenario and a downward scenario, strong support can be provided near 1.1120, and below, in the price zone of 1.1090-1.1077. At 1.1120, the Tenkan line of the Ichimoku indicator passes, and the price zone has already shown itself as a strong technical area, besides there are Kijun, 89 exponents, the upper boundary of the Ichimoku cloud and 50 simple moving average.
Such benchmarks of the price movement of EUR/USD are viewed on the daily chart. Let's move on to a smaller time frame.
H4
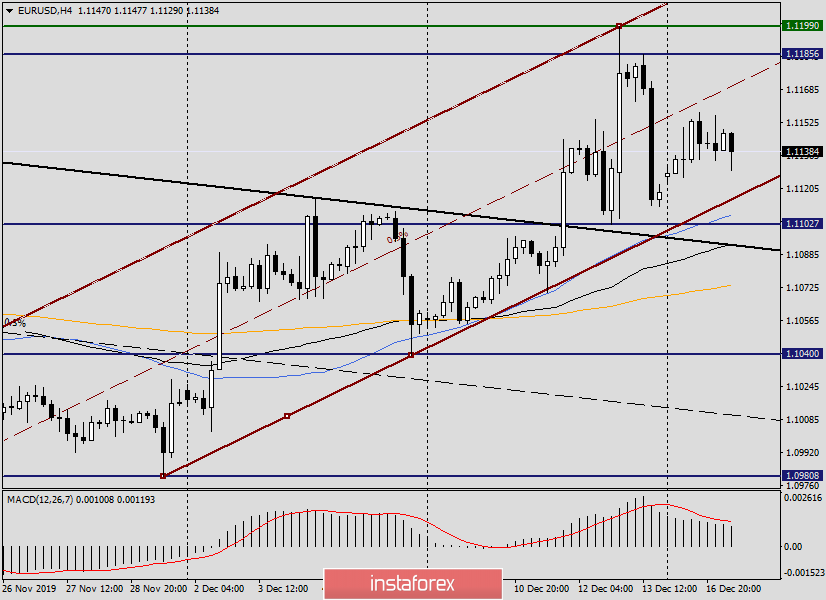
We see that Monday's trading opened with a small gap up, which has not yet been closed. At the time of completion of this article, the pair is trading in a relatively narrow range, while showing a desire to move up.
If the players on the increase in the rate manage to resume raising the quote, it is worth paying attention to the blue resistance line of 1.1412-1.11199, which runs near 1.1193, that is, near the last highs and the key resistance at the moment 1.11199. The appearance of bearish candlestick patterns in the area of 1.1175-1.1200 will be a signal for opening sales.
Since on this timeframe, the euro/dollar is traded in an upward channel, and even above the moving averages used, with a decrease in the price zone of 1.1120-1.1080, it is worth considering buying EUR/USD, the confirmation for the opening of which will also be the corresponding models of Japanese candlesticks. At the moment, this view and trading ideas on the main currency pair. However, it should be admitted that the situation is far from certain.
Successful trading!


