


Hello!
At last week's trading, the Japanese yen was the only major currency that fell against the US dollar. The past five-day period was generally very volatile, helped by reports about the progress of trade negotiations between the US and China, as well as the results of early parliamentary elections in the UK.
This week, those who trade USD/JPY should pay attention to the decision on the rates of the Bank of Japan and the press conference of the Japanese Central Bank, as well as numerous statistics from the United States, the reaction to which this currency pair is perhaps the strongest. All the details of macroeconomic statistics can be seen in the economic calendar
Now let's move on to the price charts and start with the weekly timeframe, where the importance of the current moment is seen.
Weekly
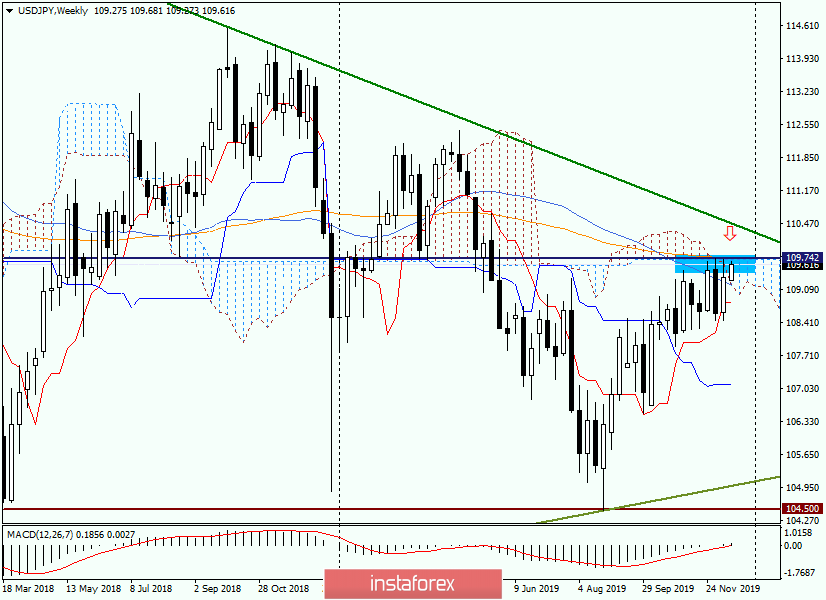
Of course, we are talking about the ongoing assault of a strong technical resistance zone near 109.75. As you can see, in addition to the maximum values of the last three weeks, the upper boundary of the Ichimoku indicator cloud passes here, as well as a strong 144 exponential moving average. Characteristically, 144 EMA is very strong for pairs with the Japanese currency.
Bulls on USD/JPY cannot overcome this obstacle, but even if it happens, the pair will face no less difficult tests in the form of a psychological mark of 110 yen per dollar, a strong technical level of 110.20 and a green resistance line of 125.30-114.20, which passes near 110.50.
All of the above is quite strong and difficult to pass resistance, so the market will need a significant driver to overcome all the obstacles indicated, the true breakdown of the green line and the closing of weekly trading above. Alternatively, there should be a strong risk appetite in the market. As a rule, at such moments, the safe-haven currency, which is the yen, ceases to be in demand and weakens.
If trading on December 16-20 ends under the current resistance of 109.70/75 and a bearish candlestick analysis model appears, this can be perceived as a signal to open short positions. Fortunately, it is not necessary to set a big stop, and above the area of 110.00-110.20 may well throw the pair down, or even turn the quote in the south direction.
For objectivity, it is necessary to designate the nearest goals below. This is the 50th moving average and the lower boundary of the Ichimoku cloud, which converged near 109.18, and below the Tenkan line, running at 108.80.
Daily
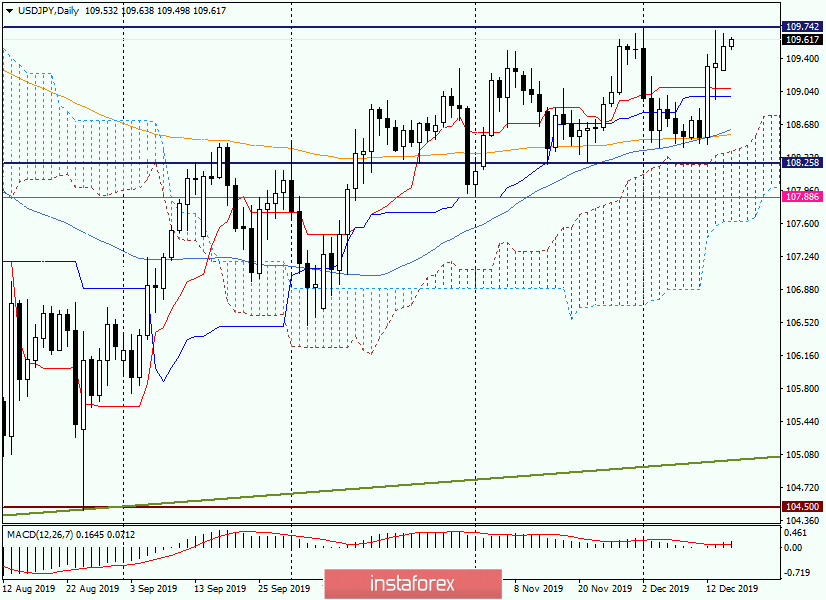
On this timeframe, first of all, the candle for December 13 attracts attention. This is a reversal model of candlestick analysis "Long-Legged Doji". The fact that the maximums of this candle turned out to be lower than the previous ones for December 2 is very indicative. This model keeps the chances of its working out as long as its bullish absorption has not occurred, that is, there is no closing price above 109.71 (highs on December 13). But even in the case of a bullish takeover, the resistances indicated earlier can turn the price down. In my opinion, the situation is very complex, important and ambiguous.
Do not reveal the secret of what's under the resistors, it is customary to consider sales. At the same time, the tactics of trading on the breakdown has not been canceled. However, it seems to me that in the current situation, to trade on the breakdown is too risky. There are many strong resistances above. Unless the US and China agree on a deal, and the market will be flooded with the euphoria of optimism and there will be a huge appetite for risk. Everything may be, everything may become, but this option seems less likely.
I propose to wait for the completion of today's trading, the formed candle, and its closing price. In the case of a bearish candlestick pattern, you can try to sell with the removal of the stop above 110.00, and preferably 110.20, and the nearest targets in the areas of 109.10-109.00 and 108.80-108.60.
I believe that it is better to refrain from buying in the current situation, it is too risky.
Successful and profitable trades!


