


To open long positions on EURUSD, you need:
Yesterday's data on the sharp growth of industrial production in the US was much better than economists' forecasts and led to the strengthening of the US dollar, not allowing the EUR/USD pair to get beyond the resistance of 1.1165, which will be emphasized today in the first half of the day. Only its breakthrough will lead to an upward correction of EUR/USD in the area of highs of 1.1198 and 1.1226, where I recommend taking the profits. However, much will depend on eurozone inflation data, a slowdown in which could hit euro positions. Therefore, if the pair declines, only the formation of a false breakout in the support area of 1.129 will be the first signal to open long positions in the euro. Buying immediately on the rebound is best from the levels of 1.1090 and 1.1041. We should also pay attention to the speech of the President of the European Central Bank, Christine Lagarde, which will be held today in the morning.
To open short positions on EURUSD, you need:
Sellers are not active, and the low volatility of the market discourages any desire to storm and break this week's low. Weak eurozone inflation statistics may lead to a return of EUR/USD to the support area of 1.129. However, the only consolidation below this level will increase the pressure on the euro and lead to a downward correction in the area of lows of 1.129 and 1.1090, where I recommend taking the profits. If the pair grows in the first half of the day, only a false breakout in the area of 1.1165 will be a signal to open short positions. Otherwise, I recommend selling EUR/USD immediately on the rebound only from the maximum of 1.1198.
Indicator signals:
Moving Averages
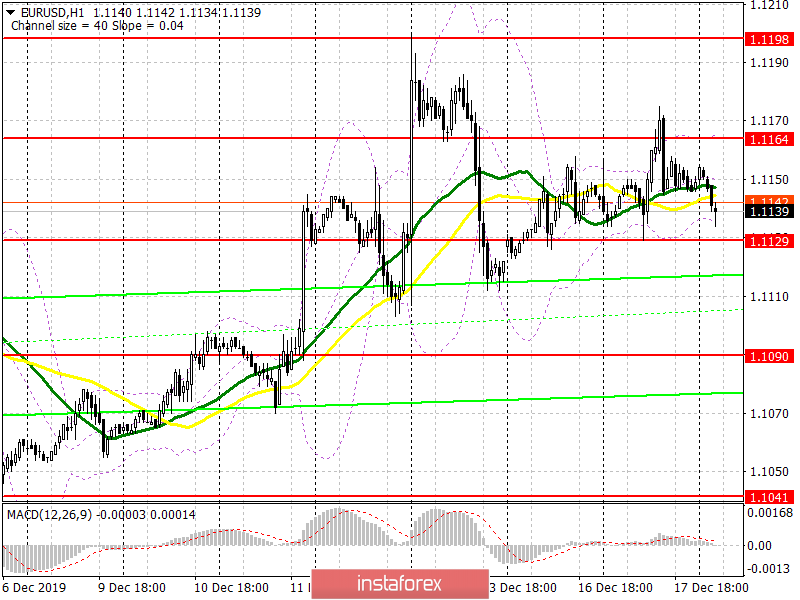
Trading is conducted in the area of 30 and 50 moving averages, which indicates the lateral nature of the market.
Bollinger Bands
Breaking the upper limit of the indicator around 1.1164 will lead to a sharp increase in the European currency. The breakdown of the lower border, which coincides with the support of 1.129, will increase the pressure on the euro.
Description of indicators
- Moving average (moving average determines the current trend by smoothing out volatility and noise). Period 50. The graph is marked in yellow.
- Moving average (moving average determines the current trend by smoothing out volatility and noise). Period 30. The graph is marked in green.
- MACD indicator (Moving Average Convergence / Divergence - Moving Average Convergence / Divergence). Fast EMA Period 12. Slow EMA Period 26. SMA Period 9.
- Bollinger Bands (Bollinger Bands). Period 20.


