


To open long positions on GBPUSD, you need:
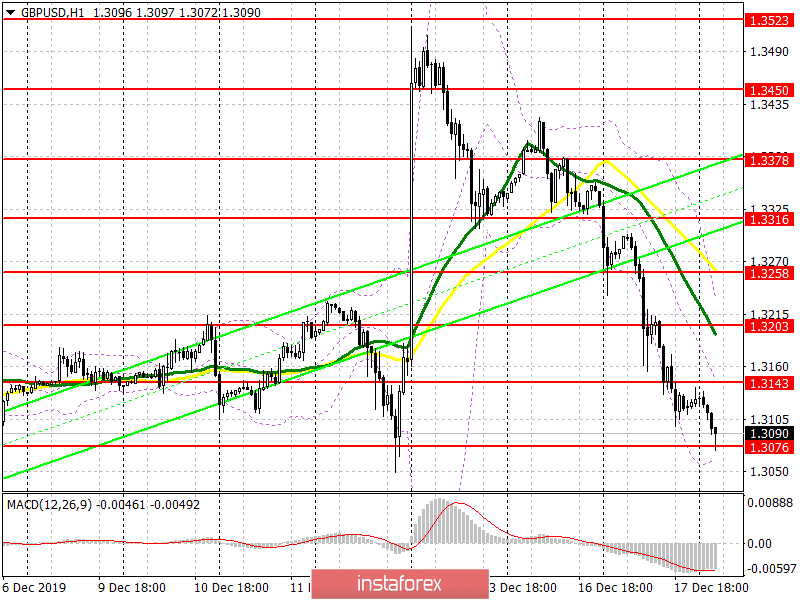
Weak reports on the UK economy, which come out throughout this week, clearly indicate the problems to which the British pound reacts so sharply, losing its positions against the US dollar. Today, the focus will shift to inflation. If it shows weak growth or even shrinks, the pound will likely decline further. In this scenario, it is best to look for long positions after the formation of a false breakout in the support area of 1.3076, but it is best to buy immediately on the rebound from the lows of 1.3013 and 1.2952, where a bullish divergence on the MACD indicator can also be formed. Another, no less important, task of the bulls will be the return and consolidation above the resistance of 1.3143, which will allow us to talk about an upward correction in the area of the highs of 1.3203 and 1.3316, where I recommend taking the profits.
To open short positions on GBPUSD, you need:
I think not many people expected such a large fall in the pound after the victory of the Conservative Party of Great Britain. Boris Johnson's rush to withdraw from the EU does not add to investors' confidence. Now, the bears are aimed at breaking the support of 1.3076, which will lead to a downward trend in the area of lows of 1.3013 and 1.2952, where I recommend taking the profits, as bullish divergence on the MACD indicator (hourly chart) can be formed at these levels. If the bulls try to return to the market on the background of good inflation in the UK, the bears will be active at the level of 1.3143, but it is best to open short positions from there if a false breakout is formed. You can sell the pound immediately on the rebound after updating the highs of 1.3203 and 1.3258.
Indicator signals:
Moving Averages
Trading is below the 30 and 50 moving averages, which indicates a possible decline in the pound in the short term.
Bollinger Bands
In the case of a decline in the pound, support will be provided by the lower border of the indicator around 1.3070, a breakthrough of which will lead to a new wave of the pair's fall. Growth will be limited by the average level of the indicator in the area of 1.3143.
Description of indicators
- Moving average (moving average determines the current trend by smoothing out volatility and noise). Period 50. The graph is marked in yellow.
- Moving average (moving average determines the current trend by smoothing out volatility and noise). Period 30. The graph is marked in green.
- MACD indicator (Moving Average Convergence / Divergence - Moving Average Convergence / Divergence). Fast EMA Period 12. Slow EMA Period 26. SMA Period 9.
- Bollinger Bands (Bollinger Bands). Period 20.


