


Hello, dear colleagues!
Today's article will begin with macroeconomic indicators, which were published the day before.
Yesterday, the US Department of Commerce announced that the number of new buildings increased to 1.365 million, and it was 3.2% more than the previous figure. Also in November, the number of building permits in the United States came out better than expected 1.41 million and was at 1.482 million, which is 1.4% more than a month earlier.
As for industrial production in the United States, its volume grew more than experts expected - growth expectations of 0.8%, and in fact, received a November growth of 1.1%.
As for the eurozone, we heard the statement of the ECB representative Peter Kazimir (head of the Central Bank of Slovakia) that economic growth in the euro area will remain sluggish until several structural problems in the currency bloc are resolved. At the same time, it was stated that by 2022, economic growth in the eurozone could become even weaker.
Probably, these factors have influenced the price dynamics of the EUR/USD currency pair, which at the trading on December 17 showed growth, but there was a rather ambiguous picture. Let's see how this has affected the euro/dollar price charts, and whether there are signals about entering the market.
Daily
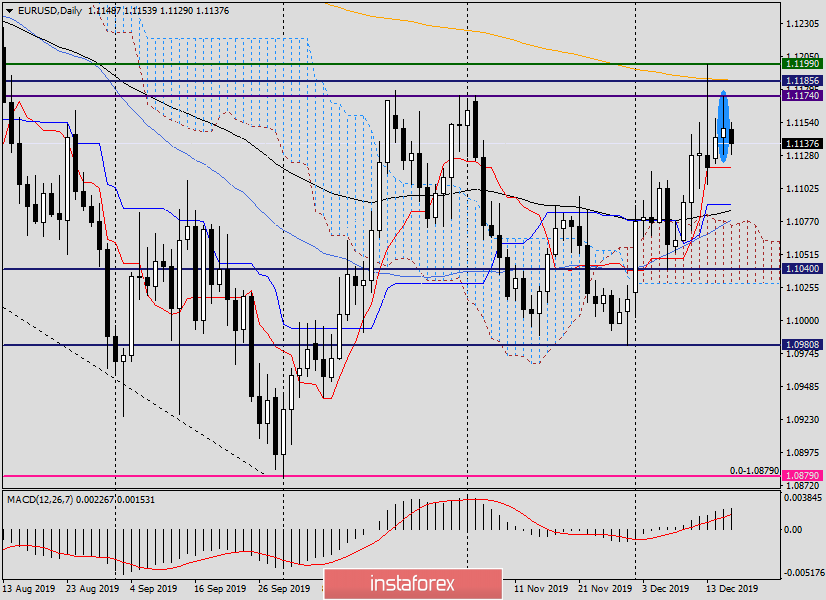
Yesterday's attempts by European bears to raise the rate above the strong resistance zone 1.1185-1.11199 were not successful. Tuesday's trading highs were only at 1.1174, after which the pair fairly bounced down and finished the session at 1.1149.
As a result, a candle with a sufficiently long upper shadow appeared on the daily chart, which is several times larger than the bullish body itself. Such a candle can be considered a bearish signal and we should expect a subsequent decline in the rate, which happens at the time of writing.
Thus, judging by the daily chart, I assume a decline in the rate, which means that it is worth considering the points for opening short positions on the euro/dollar. However, this is best done on smaller timeframes.
H4
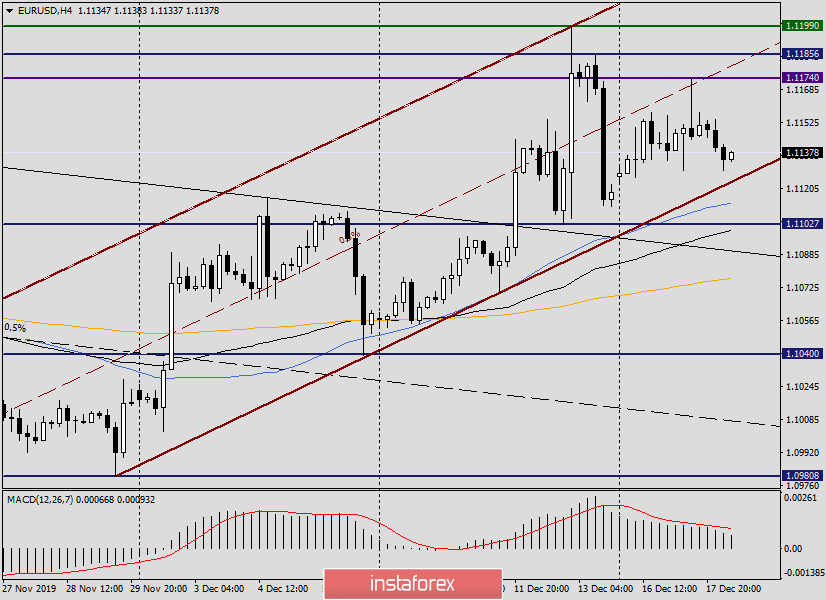
Again, I draw your attention to the impact on the price of the average channel lines. In this case, I built a brown upward channel with the parameters: 1.0981-1.1070 (support line) and 1.11199 (resistance line).
As you can see, the middle line of this channel yesterday stopped the rise, after which there was a bearish candlestick model with a long upper shadow. As a rule, after the appearance of such candles, there is a decline in the rate, which is observed.
However, at the moment, the pair continues to trade in the upward channel, in the lower part of it. If you follow the strategy of trading in price channels, near the support line, you should look closely at purchases. Moreover, a little lower are the 50 simple and 89 exponential moving averages. In this case, you can count on a false breakdown of the lower border of the channel, support near 50 MA and (or) 89 EMA, after which the pair will turn up and again be within the channel.
It should be borne in mind that even lower, at 1.1077, there is a strong 233 exhibitor, which is also able to provide good support and send the course in a northerly direction.
H1
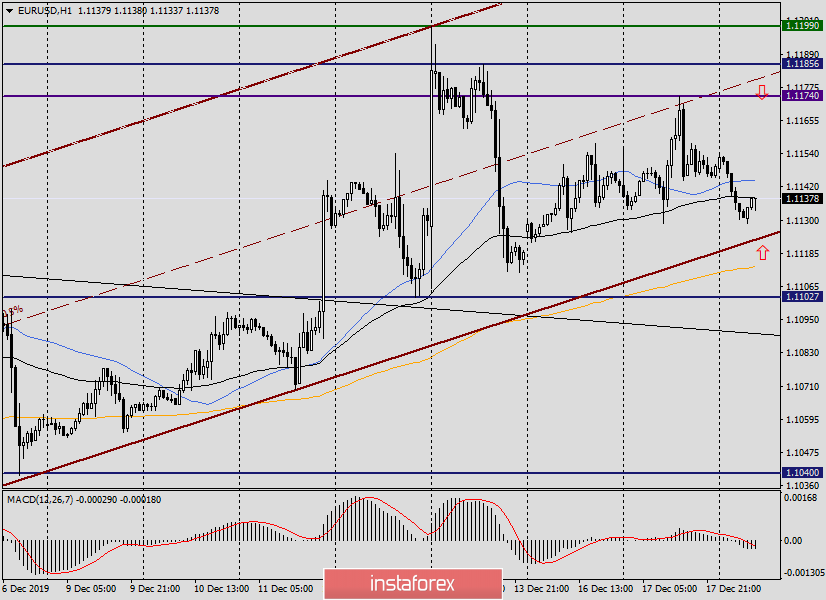
Finally, we reached the hourly chart, where the idea of buying, in the case of a false breakdown of the lower border of the channel, is confirmed by finding at 1.1114 233 EMA.
At the time of completion of the review, the pair is trading under the hourly 89 EMA with 50 MA, which actively resists attempts to grow. The arrows show the most interesting, from my point of view, options for opening positions. Sales on the approach to the middle line of the channel and the price zone of resistance of 1.1174-1.1185, and purchases from the support area of 1.1125-1.1113.
The situation for positioning is complex and in many ways contradictory. In such cases, the most relevant and strong signals are on higher timeframes. In our case, this is a daily chart, which with a high probability (yesterday's candle) signals a downward scenario for EUR/USD.
Today's statistics from Europe (IFO business climate index for Germany, as well as data on consumer prices in the euro area) may affect EUR/USD trading and affect the technical picture, which is difficult to call unequivocal. And yet more inclined to the fact that the market for the euro/dollar today will be under the control of sellers. Alternatively, aggressively and risky, you can try selling from current prices or after a true breakdown of the support line of the channel, on the rollback to the broken line.
Successful trading!


