


Trend analysis.
This week, the price will move up with the first target of 1.1174 - the upper fractal. When breaking through the top of this level, the next top target will be a pullback level of 61.8% - 1.1208 (blue dotted line).
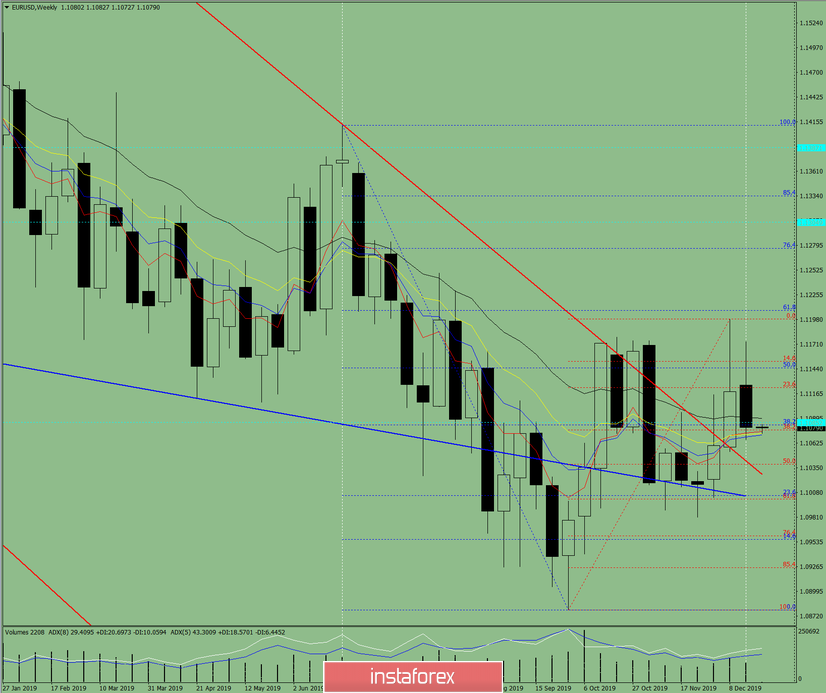
Fig. 1 (weekly chart).
Complex analysis:
- Indicator analysis - up;
- Fibonacci levels - up;
- Volumes - up;
- Candle analysis - up;
- Trend analysis - top;
- Bollinger Bands - up;
- Monthly chart - up.
The conclusion of the complex analysis - an upward movement.
The total result of calculating the candle of the EUR / USD currency pair according to the weekly chart: the price of the week is likely to have an upward trend, with the absence of the first lower shadow of the weekly white candlestick (Monday - up) and the absence of the second upper shadow (Friday - up).
An unlikely lower scenario - a downward movement from the first lower target of 1.1039 - a pullback level of 50.0% (red dotted line). If successful, the next lower target - the pullback level of 61.8% - 1.151 (red dotted line).


