


Trend analysis.
This week, the price will move down with the first target of 1.2925 - a pullback level of 38.2% (red dotted line). If it is achieved, the continuation of work down with the target of 1.2741 is a pullback level of 50.0% (red dotted line).
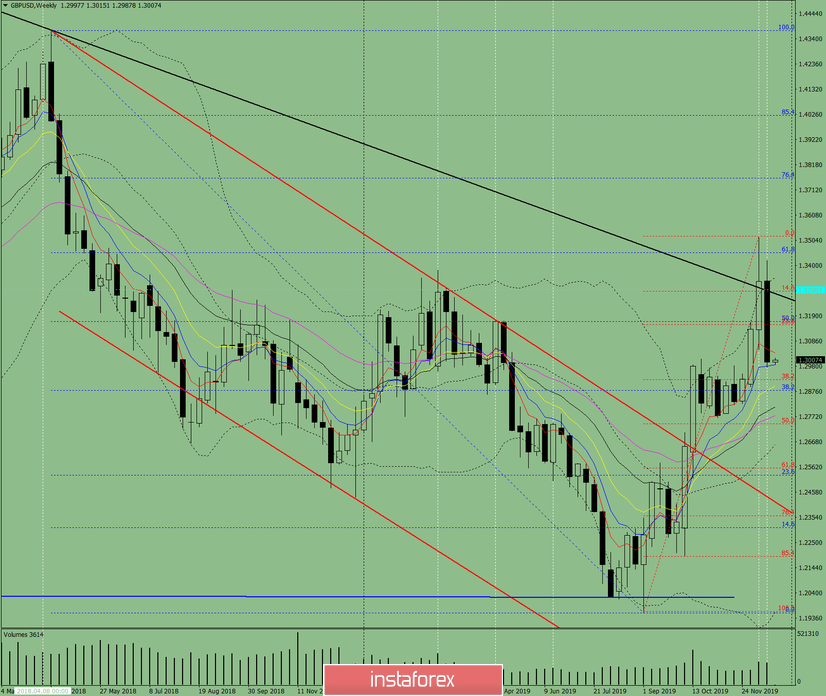
Fig. 1 (weekly chart).
Complex analysis:
- Indicator analysis - down;
- Fibonacci levels - down;
- Volumes - down;
- Candlestick analysis - down;
- Trend analysis - down;
- Bollinger Bands - down;
- Monthly chart - down.
The conclusion of the complex analysis - a downward movement.
The overall result of calculating the candle of the GBP / USD currency pair according to the weekly chart: the price of the week is likely to have a downward trend with the absence of the first upper shadow of the weekly black candlestick (Monday - down) and the absence of the second lower shadow (Friday - down).
An unlikely scenario - from the retracement level 38.2% - 1.2925 (red dotted line); work up with the target of 1.3166 - the retracement level is 50.0% (blue dashed line).


